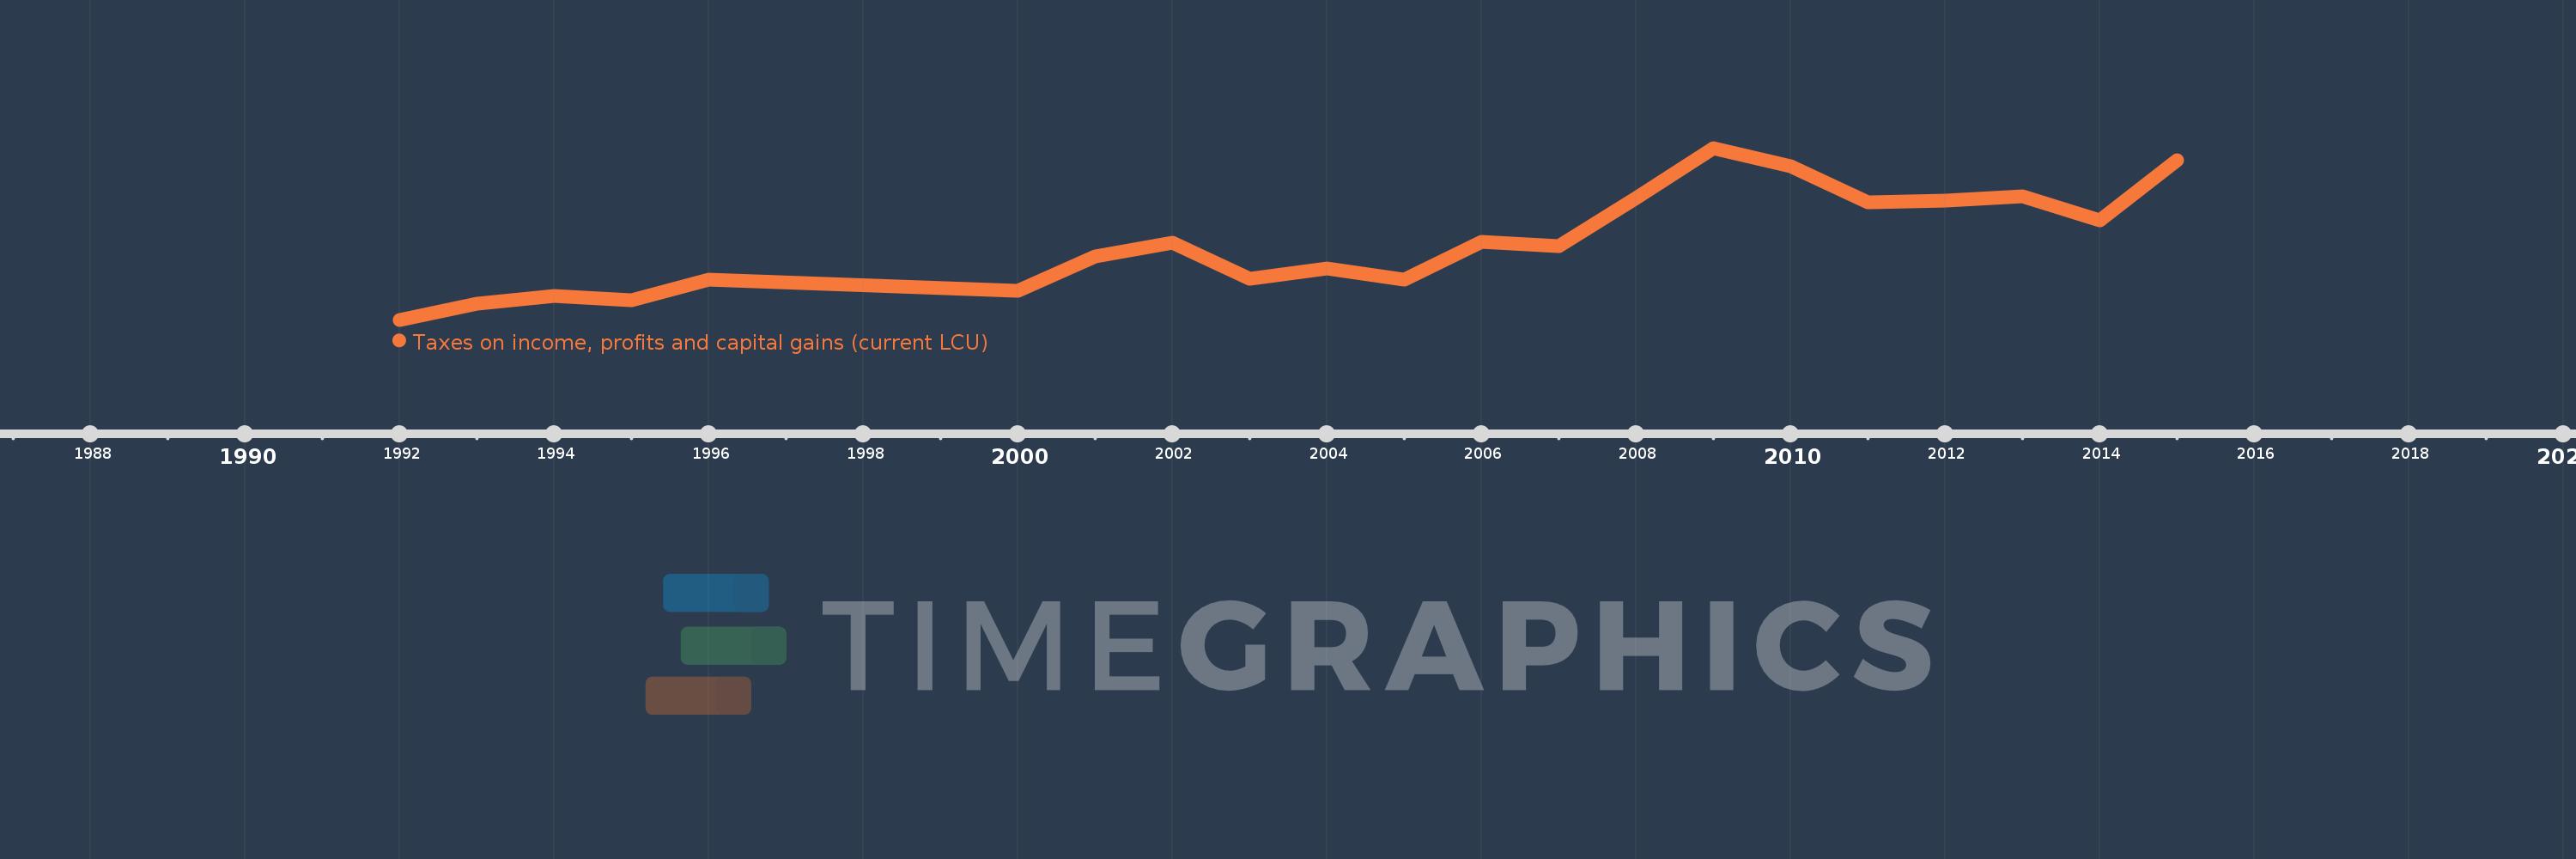
Cette échelle de temps montre un graphique de 1992 année à 2015 année Grenada. Les données jusqu'à 1991 année ne sont pas présentés. Quantité d'observations actuelles selon dates: 21.
Source (désignation):
Les indicateurs du développement mondiale
Source (organisation):
International Monetary Fund, Government Finance Statistics Yearbook and data files.
Catégories:
Public Sector
Dernière mise à jour
23 avr. 2017
Les indicateurs de changement de valeurs selon les années
En moyenne:
57.429 mln.
Minimum:
27.29 mln.
1 janv. 1992
Maximum:
94.559 mln.
1 janv. 2009
Pour la date d''observation
Valeur
Changement absolu
Le changement par rapport à la valeur précédente
1 janv. 1992
27.29 mln.
+27.29 mln.
0.0%
1 janv. 1993
33.59 mln.
+6.3 mln.
23.09%
1 janv. 1994
36.44 mln.
+2.85 mln.
8.48%
1 janv. 1995
34.8 mln.
-1.64 mln.
-4.5%
1 janv. 1996
43.06 mln.
+8.26 mln.
23.74%
1 janv. 2000
38.6 mln.
-4.46 mln.
-10.36%
1 janv. 2001
51.93 mln.
+13.33 mln.
34.53%
1 janv. 2002
57.36 mln.
+5.43 mln.
10.46%
1 janv. 2003
43.47 mln.
-13.89 mln.
-24.22%
1 janv. 2004
47.49 mln.
+4.02 mln.
9.25%
1 janv. 2005
43.018 mln.
-4.472 mln.
-9.42%
1 janv. 2006
57.707 mln.
+14.689 mln.
34.15%
1 janv. 2007
56.033 mln.
-1.674 mln.
-2.9%
1 janv. 2008
74.833 mln.
+18.8 mln.
33.55%
1 janv. 2009
94.559 mln.
+19.726 mln.
26.36%
1 janv. 2010
87.232 mln.
-7.327 mln.
-7.75%
1 janv. 2011
73.189 mln.
-14.042 mln.
-16.1%
1 janv. 2012
73.893 mln.
+703.235 milles
0.96%
1 janv. 2013
75.494 mln.
+1.602 mln.
2.17%
1 janv. 2014
66.11 mln.
-9.384 mln.
-12.43%
1 janv. 2015
89.905 mln.
+23.794 mln.
35.99%
Classement des pays selon les statistiques actuelles par années