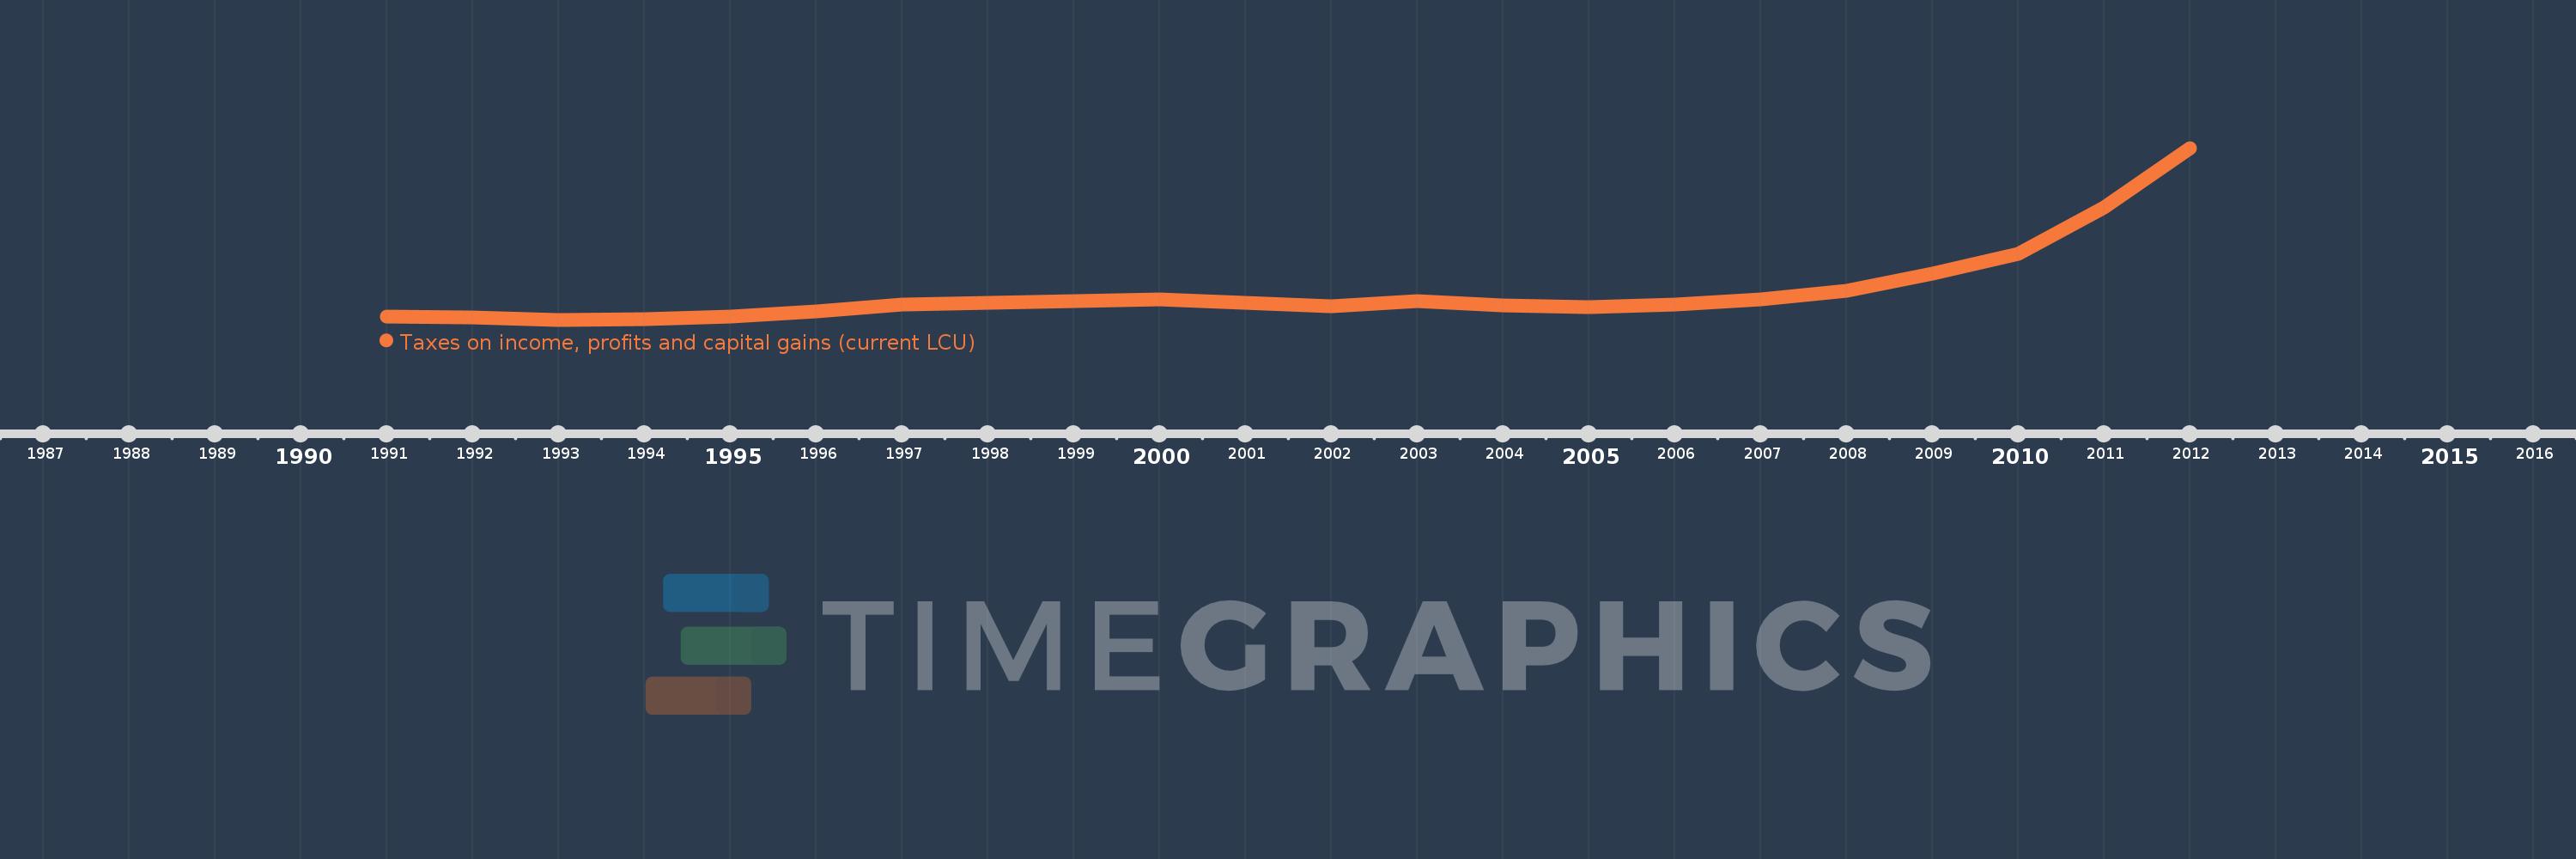
Cette échelle de temps montre un graphique de 1991 année à 2012 année Ethiopia. Les données jusqu'à 1990 année ne sont pas présentés. Quantité d'observations actuelles selon dates: 21.
Source (désignation):
Les indicateurs du développement mondiale
Source (organisation):
International Monetary Fund, Government Finance Statistics Yearbook and data files.
Catégories:
Public Sector
Dernière mise à jour
23 avr. 2017
Les indicateurs de changement de valeurs selon les années
En moyenne:
2.644 mds
Minimum:
660.0 mln.
1 janv. 1993
Maximum:
12.414 mds
1 janv. 2012
Pour la date d''observation
Valeur
Changement absolu
Le changement par rapport à la valeur précédente
1 janv. 1991
889.9 mln.
+889.9 mln.
0.0%
1 janv. 1992
798.0 mln.
-91.9 mln.
-10.33%
1 janv. 1993
660.0 mln.
-138.0 mln.
-17.29%
1 janv. 1994
693.6 mln.
+33.6 mln.
5.09%
1 janv. 1995
899.6 mln.
+206.0 mln.
29.7%
1 janv. 1996
1.254 mds
+354.0 mln.
39.35%
1 janv. 1997
1.677 mds
+422.9 mln.
33.73%
1 janv. 1998
1.808 mds
+131.5 mln.
7.84%
1 janv. 1999
1.943 mds
+135.3 mln.
7.48%
1 janv. 2000
2.081 mds
+138.1 mln.
7.11%
1 janv. 2002
1.574 mds
-507.0 mln.
-24.36%
1 janv. 2003
1.915 mds
+340.2 mln.
21.61%
1 janv. 2004
1.663 mds
-251.8 mln.
-13.15%
1 janv. 2005
1.512 mds
-150.3 mln.
-9.04%
1 janv. 2006
1.686 mds
+173.1 mln.
11.44%
1 janv. 2007
2.066 mds
+380.4 mln.
22.57%
1 janv. 2008
2.636 mds
+570.0 mln.
27.59%
1 janv. 2009
3.799 mds
+1.163 mds
44.11%
1 janv. 2010
5.194 mds
+1.395 mds
36.72%
1 janv. 2011
8.354 mds
+3.16 mds
60.85%
1 janv. 2012
12.414 mds
+4.06 mds
48.6%
Classement des pays selon les statistiques actuelles par années