33
/fr/
AIzaSyAYiBZKx7MnpbEhh9jyipgxe19OcubqV5w
August 1, 2025
140855
Ghana
GHA
true
2
1
Percentage of female teachers in primary education who are trained, female (%)
2016,2015,2014,2013,2012,2010,2009,2008,2006,2005,2004,2003,2002,2001,2000
Download
Bibliothèque de statistiques globales →Ghana →

Percentage of female teachers in primary education who are trained, female (%)

Cette statistique dans les autres pays:

AlgeriaAndorraAngolaAntigua and BarbudaArab WorldArmeniaArubaAzerbaijanBahamas, TheBahrainBangladeshBarbadosBelarusBelizeBeninBermudaBhutanBoliviaBotswanaBritish Virgin IslandsBrunei DarussalamBurkina FasoBurundiCabo VerdeCambodiaCameroonCaribbean small statesCayman IslandsCentral African RepublicColombiaComorosCongo, Dem. Rep.Congo, Rep.Costa RicaCote d'IvoireCroatiaCubaDjiboutiDominicaDominican RepublicEcuadorEgypt, Arab Rep.El SalvadorEquatorial GuineaEritreaEthiopiaFijiFragile and conflict affected situationsGabonGambia, TheGeorgiaGhanaGibraltarGrenadaGuineaGuinea-BissauGuyanaHeavily indebted poor countries (HIPC)HondurasHong Kong SAR, ChinaIDA blendIDA onlyIDA totalIran, Islamic Rep.IraqJamaicaKazakhstanKenyaKiribatiKuwaitKyrgyz RepublicLao PDRLeast developed countries: UN classificationLebanonLesothoLiberiaLow incomeMacao SAR, ChinaMadagascarMalawiMalaysiaMaldivesMaliMauritaniaMauritiusMiddle East & North AfricaMiddle East & North Africa (excluding high income)Middle East & North Africa (IDA & IBRD countries)MoldovaMongoliaMoroccoMozambiqueMyanmarNamibiaNauruNepalNicaraguaNigerNigeriaOmanOther small statesPacific island small statesPakistanPanamaParaguayPhilippinesPre-demographic dividendQatarRwandaSao Tome and PrincipeSaudi ArabiaSenegalSerbiaSeychellesSierra LeoneSingaporeSmall statesSolomon IslandsSouth AfricaSt. Kitts and NevisSt. LuciaSt. Vincent and the GrenadinesSub-Saharan Africa Sub-Saharan Africa (excluding high income)Sub-Saharan Africa (IDA & IBRD countries)SurinameSwazilandSyrian Arab RepublicTajikistanTanzaniaTogoTongaTrinidad and TobagoTunisiaTurks and Caicos IslandsUgandaUnited Arab EmiratesUzbekistanVietnamWest Bank and GazaZambiaZimbabwe

La ligne de temps

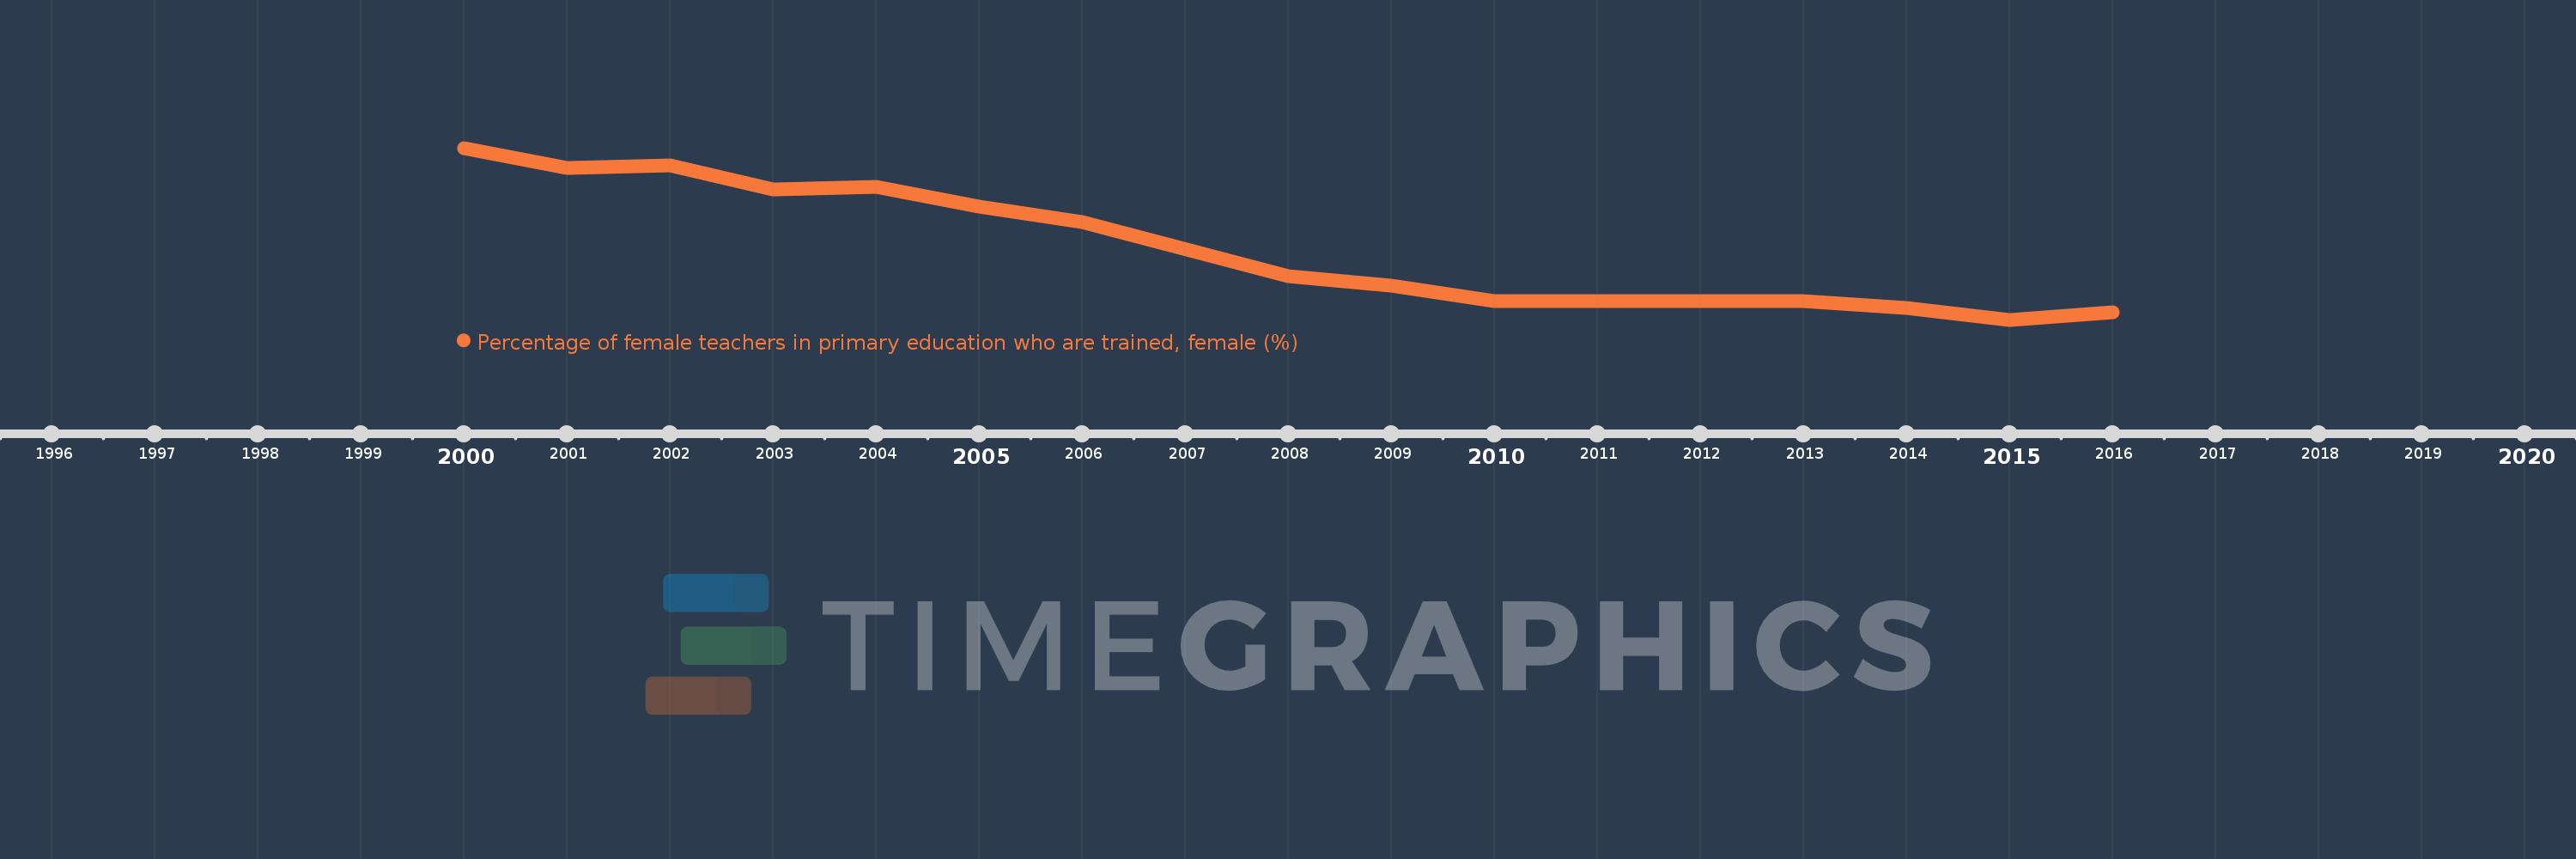
Cette échelle de temps montre un graphique de 2000 année à 2016 année Ghana. Les données jusqu'à 1999 année ne sont pas présentés. Quantité d'observations actuelles selon dates: 15.

Source (désignation):

Les indicateurs du développement mondiale

Source (organisation):

United Nations Educational, Scientific, and Cultural Organization (UNESCO) Institute for Statistics.

Catégories:

Education, Gender

Dernière mise à jour

23 avr. 2017

Les indicateurs de changement de valeurs selon les années

En moyenne:
74.226
Minimum:
63.506
1 janv. 2015
Maximum:
88.535
1 janv. 2000
Pour la date d''observation
Valeur
Changement absolu
Le changement par rapport à la valeur précédente
1 janv. 2000
88.535
+88.535
0.0%
1 janv. 2001
85.619
-2.917
-3.29%
1 janv. 2002
85.936
+0.317
0.37%
1 janv. 2003
82.471
-3.465
-4.03%
1 janv. 2004
82.828
+0.357
0.43%
1 janv. 2005
80.019
-2.809
-3.39%
1 janv. 2006
77.773
-2.245
-2.81%
1 janv. 2008
69.869
-7.904
-10.16%
1 janv. 2009
68.436
-1.434
-2.05%
1 janv. 2010
66.233
-2.202
-3.22%
1 janv. 2012
66.187
-0.046
-0.07%
1 janv. 2013
66.166
-0.021
-0.03%
1 janv. 2014
65.16
-1.006
-1.52%
1 janv. 2015
63.506
-1.654
-2.54%
1 janv. 2016
64.657
+1.151
1.81%

Classement des pays selon les statistiques actuelles par années