29
/fr/
fr
AIzaSyAYiBZKx7MnpbEhh9jyipgxe19OcubqV5w
April 1, 2024
132945
Finland
FIN
true
2
1
Claims on other sectors of the domestic economy (% of GDP)
2016,2015,2014,2013,2012,2011,2010,2009,2008,2007,2006,2005,2004,2003,2002
Download
Bibliothèque de statistiques globales →Finland →

Claims on other sectors of the domestic economy (% of GDP)

Cette statistique dans les autres pays:
AfghanistanAlbaniaAlgeriaAngolaAntigua and BarbudaArmeniaAustraliaAustriaAzerbaijanBangladeshBarbadosBelarusBelgiumBelizeBeninBhutanBoliviaBosnia and HerzegovinaBotswanaBrazilBrunei DarussalamBulgariaBurkina FasoBurundiCabo VerdeCambodiaCameroonCanadaCaribbean small statesCentral African RepublicCentral Europe and the BalticsChadChileColombiaComorosCongo, Dem. Rep.Congo, Rep.Costa RicaCote d'IvoireCroatiaCyprusCzech RepublicDenmarkDominicaDominican RepublicEast Asia & PacificEcuadorEgypt, Arab Rep.El SalvadorEquatorial GuineaEritreaEstoniaEuro areaEurope & Central AsiaEurope & Central Asia (excluding high income)Europe & Central Asia (IDA & IBRD countries)European UnionFijiFinlandFragile and conflict affected situationsFranceGabonGambia, TheGeorgiaGermanyGhanaGreeceGrenadaGuatemalaGuinea-BissauGuyanaHaitiHeavily indebted poor countries (HIPC)High incomeHondurasHungaryIcelandIDA blendIDA onlyIDA totalIndonesiaIraqIrelandIsraelItalyJamaicaJapanKazakhstanKenyaKorea, Rep.KosovoKuwaitKyrgyz RepublicLatin America & Caribbean Latin America & Caribbean (excluding high income)Latin America & the Caribbean (IDA & IBRD countries)LatviaLeast developed countries: UN classificationLesothoLithuaniaLow incomeLuxembourgMacao SAR, ChinaMacedonia, FYRMalaysiaMaldivesMaliMaltaMauritiusMexicoMiddle East & North AfricaMiddle East & North Africa (excluding high income)Middle East & North Africa (IDA & IBRD countries)MoldovaMongoliaMoroccoMozambiqueMyanmarNamibiaNepalNetherlandsNicaraguaNigerNigeriaNorth AmericaNorwayOECD membersOmanOther small statesPacific island small statesPakistanPanamaPapua New GuineaParaguayPhilippinesPolandPortugalPost-demographic dividendPre-demographic dividendQatarRomaniaRussian FederationRwandaSamoaSao Tome and PrincipeSenegalSerbiaSeychellesSierra LeoneSlovak RepublicSloveniaSmall statesSolomon IslandsSouth AfricaSouth SudanSpainSri LankaSt. Kitts and NevisSt. LuciaSt. Vincent and the GrenadinesSub-Saharan Africa Sub-Saharan Africa (excluding high income)Sub-Saharan Africa (IDA & IBRD countries)SudanSurinameSwazilandSwedenSyrian Arab RepublicTajikistanTanzaniaThailandTimor-LesteTogoTongaTrinidad and TobagoTurkeyUgandaUkraineUnited Arab EmiratesUnited StatesUruguayVanuatuVenezuela, RBWest Bank and GazaWorldZambia
La ligne de temps
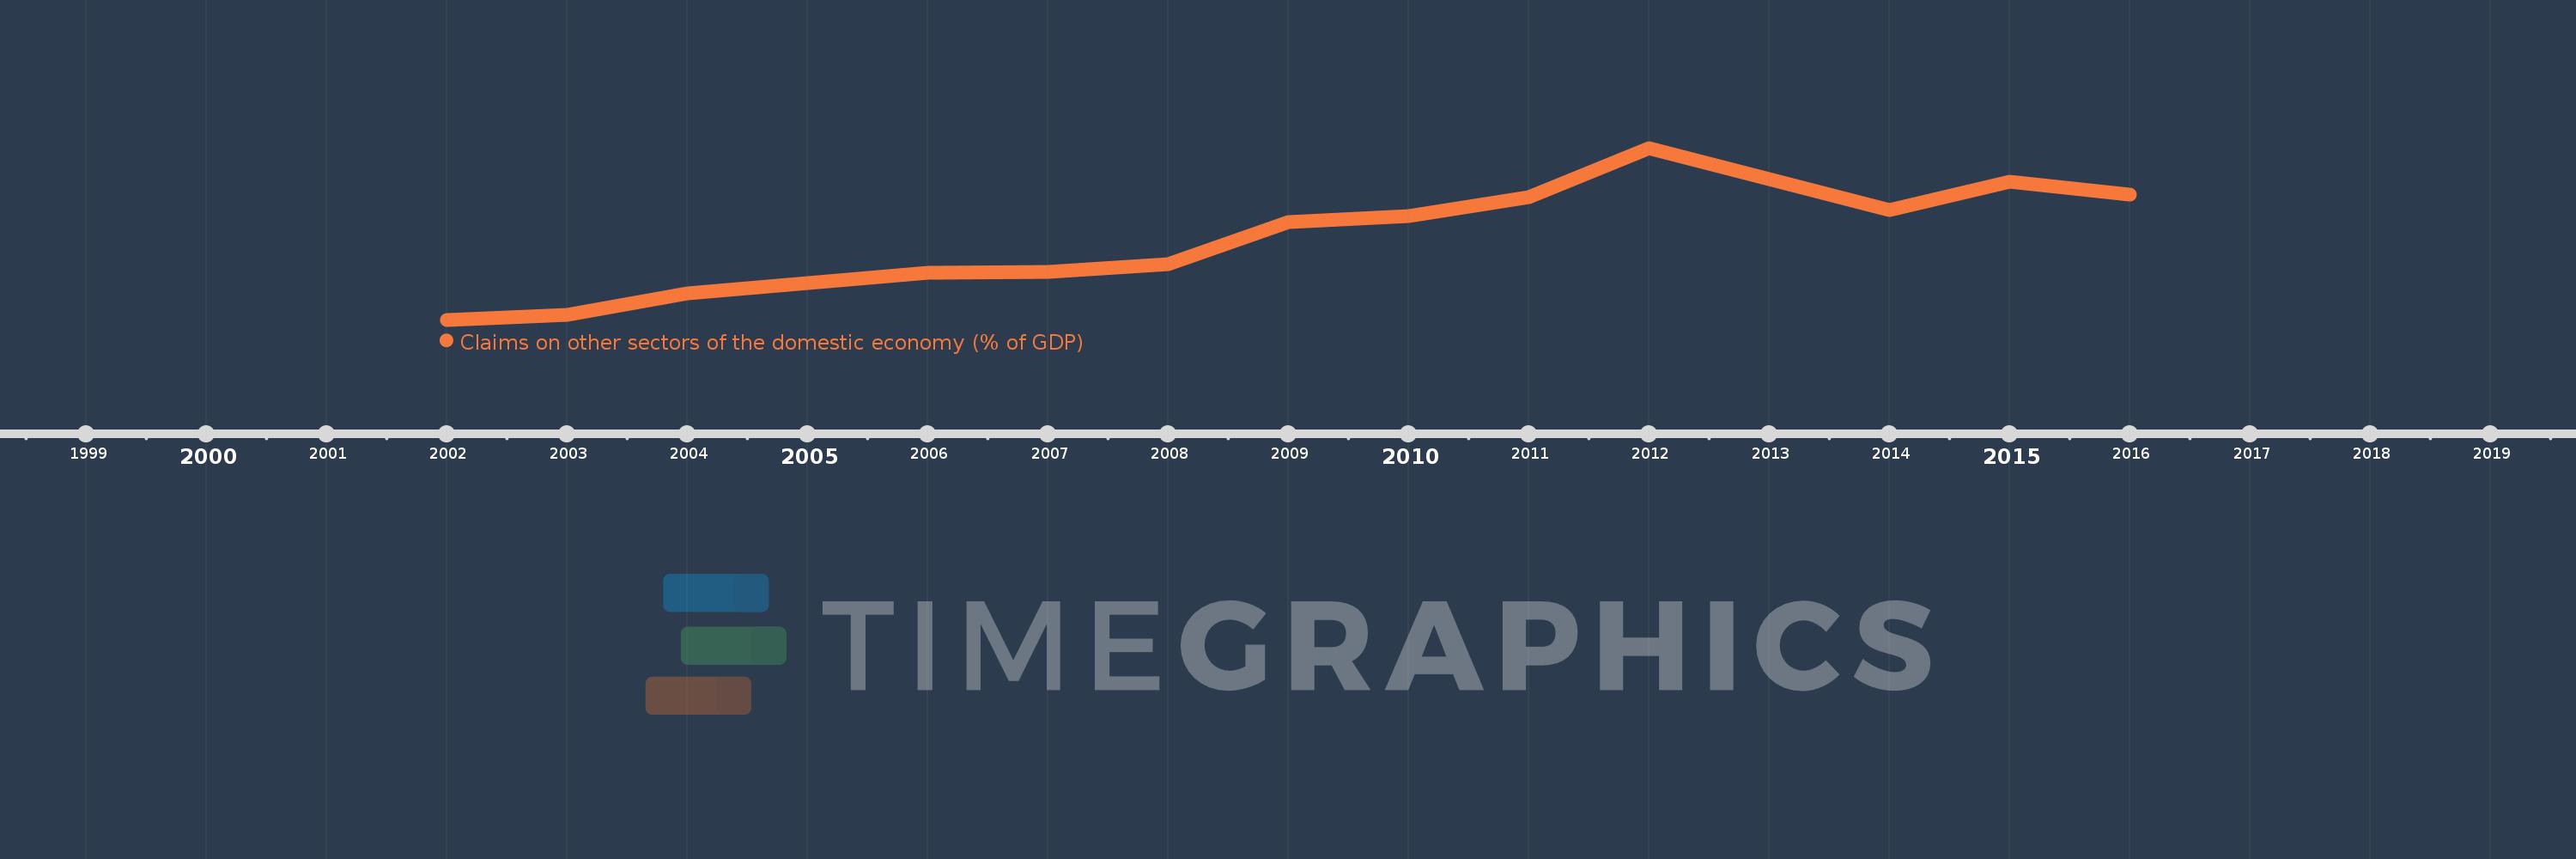
Cette échelle de temps montre un graphique de 2002 année à 2016 année Finland. Les données jusqu'à 2001 année ne sont pas présentés. Quantité d'observations actuelles selon dates: 15.
Source (désignation):
Les indicateurs du développement mondiale
Source (organisation):
International Monetary Fund, International Financial Statistics and data files, and World Bank and OECD GDP estimates.
Catégories:
Financial Sector
Dernière mise à jour
23 avr. 2017
Les indicateurs de changement de valeurs selon les années
En moyenne:
119.533
Minimum:
55.912
1 janv. 2002
Maximum:
189.502
1 janv. 2012
Pour la date d''observation
Valeur
Changement absolu
Le changement par rapport à la valeur précédente
1 janv. 2002
55.912
+55.912
0.0%
1 janv. 2003
59.915
+4.004
7.16%
1 janv. 2004
76.168
+16.253
27.13%
1 janv. 2005
84.565
+8.397
11.02%
1 janv. 2006
92.363
+7.798
9.22%
1 janv. 2007
93.118
+0.756
0.82%
1 janv. 2008
99.023
+5.905
6.34%
1 janv. 2009
131.935
+32.912
33.24%
1 janv. 2010
136.394
+4.458
3.38%
1 janv. 2011
151.425
+15.031
11.02%
1 janv. 2012
189.502
+38.077
25.15%
1 janv. 2013
165.233
-24.269
-12.81%
1 janv. 2014
141.056
-24.176
-14.63%
1 janv. 2015
163.391
+22.335
15.83%
1 janv. 2016
152.995
-10.396
-6.36%
Classement des pays selon les statistiques actuelles par années

Commentaires:

Envoyer
PremiumAbout & FeedbackUn accordConfidentialité
logo
© 2022 Selected Technologies LLC – Morgan Hill, California