29
/fr/
fr
AIzaSyAYiBZKx7MnpbEhh9jyipgxe19OcubqV5w
April 1, 2024
123234
Ecuador
ECU
true
2
1
Claims on other sectors of the domestic economy (% of GDP)
2016,2015,2014,2013,2012,2011,2010,2009,2008,2007,2006,2005,2004,2003,2002
Download
Bibliothèque de statistiques globales →Ecuador →

Claims on other sectors of the domestic economy (% of GDP)

Cette statistique dans les autres pays:
AfghanistanAlbaniaAlgeriaAngolaAntigua and BarbudaArmeniaAustraliaAustriaAzerbaijanBangladeshBarbadosBelarusBelgiumBelizeBeninBhutanBoliviaBosnia and HerzegovinaBotswanaBrazilBrunei DarussalamBulgariaBurkina FasoBurundiCabo VerdeCambodiaCameroonCanadaCaribbean small statesCentral African RepublicCentral Europe and the BalticsChadChileColombiaComorosCongo, Dem. Rep.Congo, Rep.Costa RicaCote d'IvoireCroatiaCyprusCzech RepublicDenmarkDominicaDominican RepublicEast Asia & PacificEcuadorEgypt, Arab Rep.El SalvadorEquatorial GuineaEritreaEstoniaEuro areaEurope & Central AsiaEurope & Central Asia (excluding high income)Europe & Central Asia (IDA & IBRD countries)European UnionFijiFinlandFragile and conflict affected situationsFranceGabonGambia, TheGeorgiaGermanyGhanaGreeceGrenadaGuatemalaGuinea-BissauGuyanaHaitiHeavily indebted poor countries (HIPC)High incomeHondurasHungaryIcelandIDA blendIDA onlyIDA totalIndonesiaIraqIrelandIsraelItalyJamaicaJapanKazakhstanKenyaKorea, Rep.KosovoKuwaitKyrgyz RepublicLatin America & Caribbean Latin America & Caribbean (excluding high income)Latin America & the Caribbean (IDA & IBRD countries)LatviaLeast developed countries: UN classificationLesothoLithuaniaLow incomeLuxembourgMacao SAR, ChinaMacedonia, FYRMalaysiaMaldivesMaliMaltaMauritiusMexicoMiddle East & North AfricaMiddle East & North Africa (excluding high income)Middle East & North Africa (IDA & IBRD countries)MoldovaMongoliaMoroccoMozambiqueMyanmarNamibiaNepalNetherlandsNicaraguaNigerNigeriaNorth AmericaNorwayOECD membersOmanOther small statesPacific island small statesPakistanPanamaPapua New GuineaParaguayPhilippinesPolandPortugalPost-demographic dividendPre-demographic dividendQatarRomaniaRussian FederationRwandaSamoaSao Tome and PrincipeSenegalSerbiaSeychellesSierra LeoneSlovak RepublicSloveniaSmall statesSolomon IslandsSouth AfricaSouth SudanSpainSri LankaSt. Kitts and NevisSt. LuciaSt. Vincent and the GrenadinesSub-Saharan Africa Sub-Saharan Africa (excluding high income)Sub-Saharan Africa (IDA & IBRD countries)SudanSurinameSwazilandSwedenSyrian Arab RepublicTajikistanTanzaniaThailandTimor-LesteTogoTongaTrinidad and TobagoTurkeyUgandaUkraineUnited Arab EmiratesUnited StatesUruguayVanuatuVenezuela, RBWest Bank and GazaWorldZambia
La ligne de temps
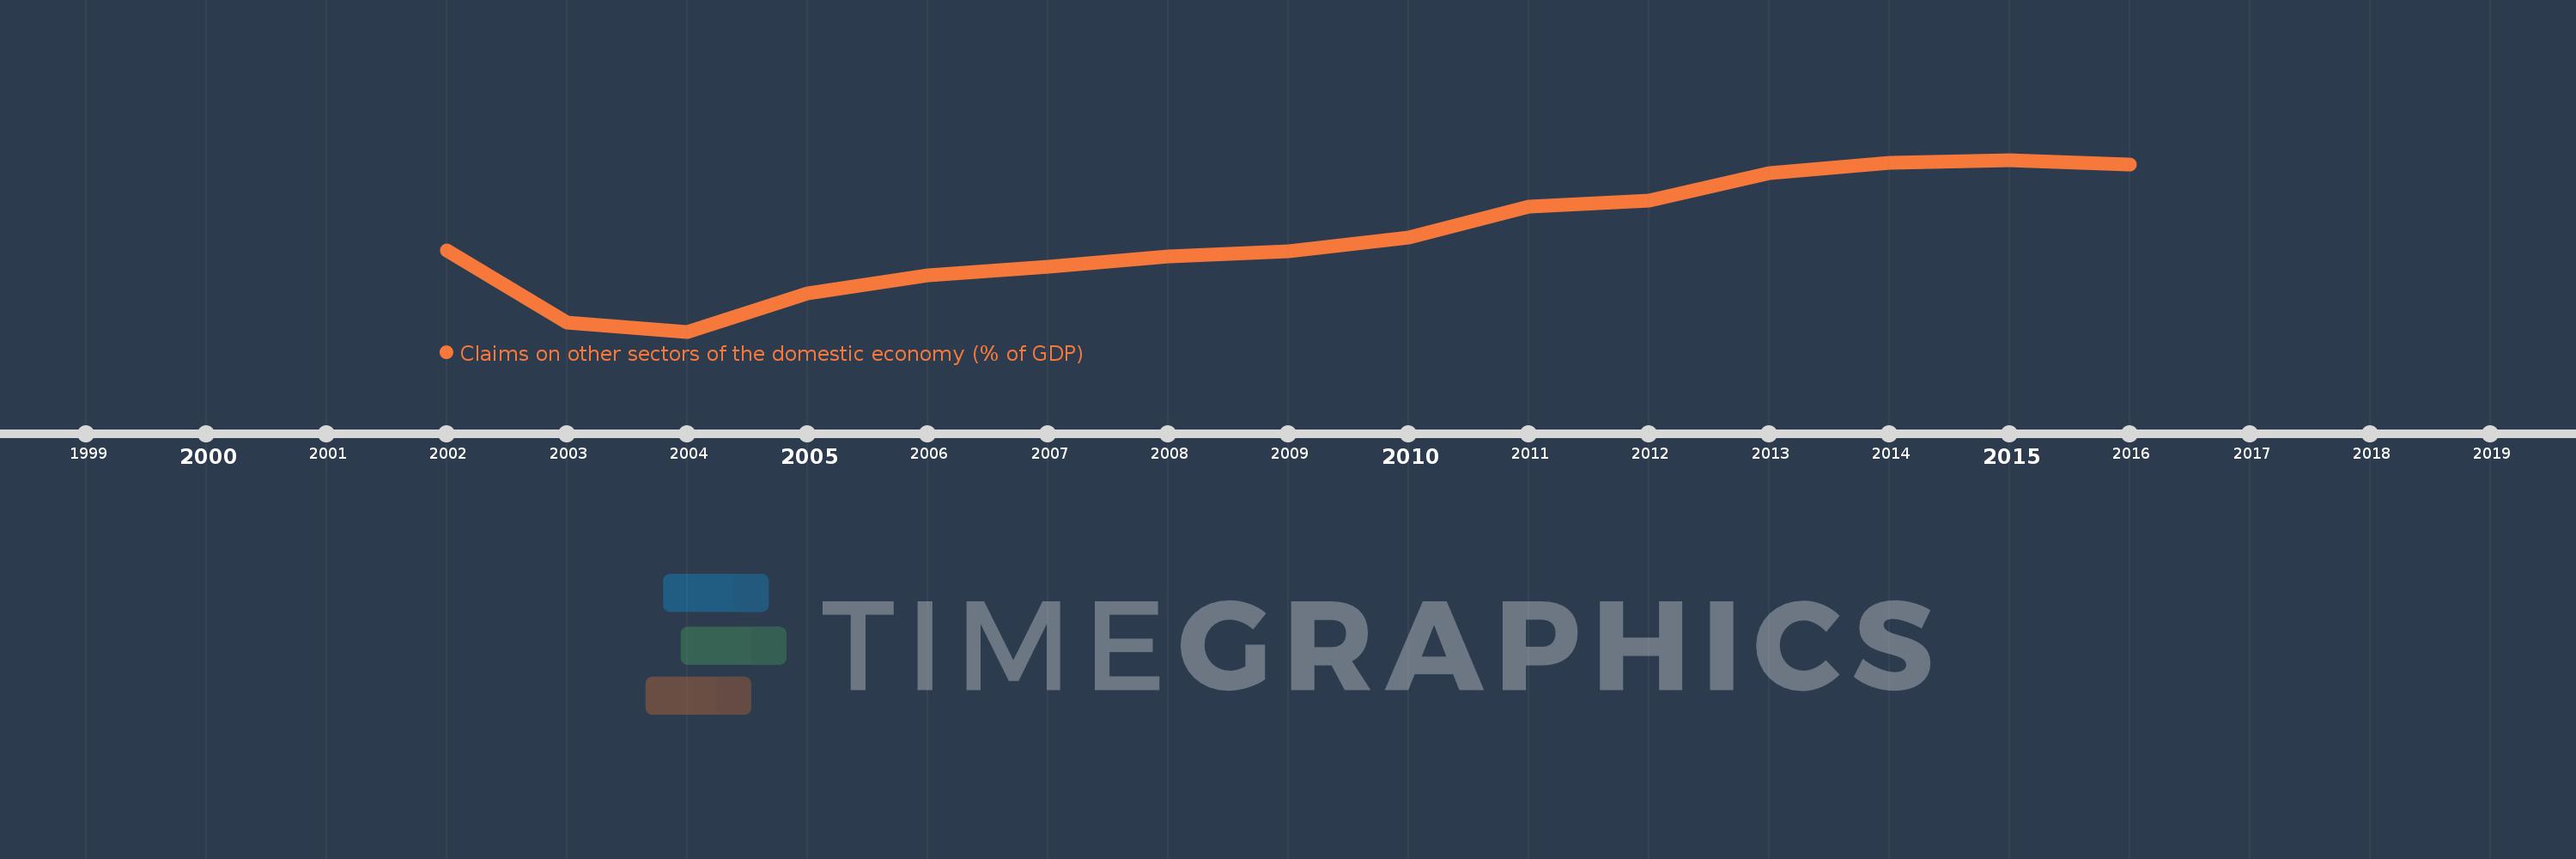
Cette échelle de temps montre un graphique de 2002 année à 2016 année Ecuador. Les données jusqu'à 2001 année ne sont pas présentés. Quantité d'observations actuelles selon dates: 15.
Source (désignation):
Les indicateurs du développement mondiale
Source (organisation):
International Monetary Fund, International Financial Statistics and data files, and World Bank and OECD GDP estimates.
Catégories:
Financial Sector
Dernière mise à jour
23 avr. 2017
Les indicateurs de changement de valeurs selon les années
En moyenne:
25.096
Minimum:
17.845
1 janv. 2004
Maximum:
30.992
1 janv. 2015
Pour la date d''observation
Valeur
Changement absolu
Le changement par rapport à la valeur précédente
1 janv. 2002
24.071
+24.071
0.0%
1 janv. 2003
18.551
-5.519
-22.93%
1 janv. 2004
17.845
-0.706
-3.81%
1 janv. 2005
20.739
+2.894
16.22%
1 janv. 2006
22.141
+1.402
6.76%
1 janv. 2007
22.815
+0.674
3.05%
1 janv. 2008
23.59
+0.775
3.4%
1 janv. 2009
24.002
+0.412
1.75%
1 janv. 2010
25.06
+1.058
4.41%
1 janv. 2011
27.431
+2.372
9.46%
1 janv. 2012
27.86
+0.428
1.56%
1 janv. 2013
29.988
+2.128
7.64%
1 janv. 2014
30.751
+0.763
2.54%
1 janv. 2015
30.992
+0.241
0.78%
1 janv. 2016
30.611
-0.381
-1.23%
Classement des pays selon les statistiques actuelles par années

Commentaires:

Envoyer
PremiumAbout & FeedbackUn accordConfidentialité
logo
© 2022 Selected Technologies LLC – Morgan Hill, California