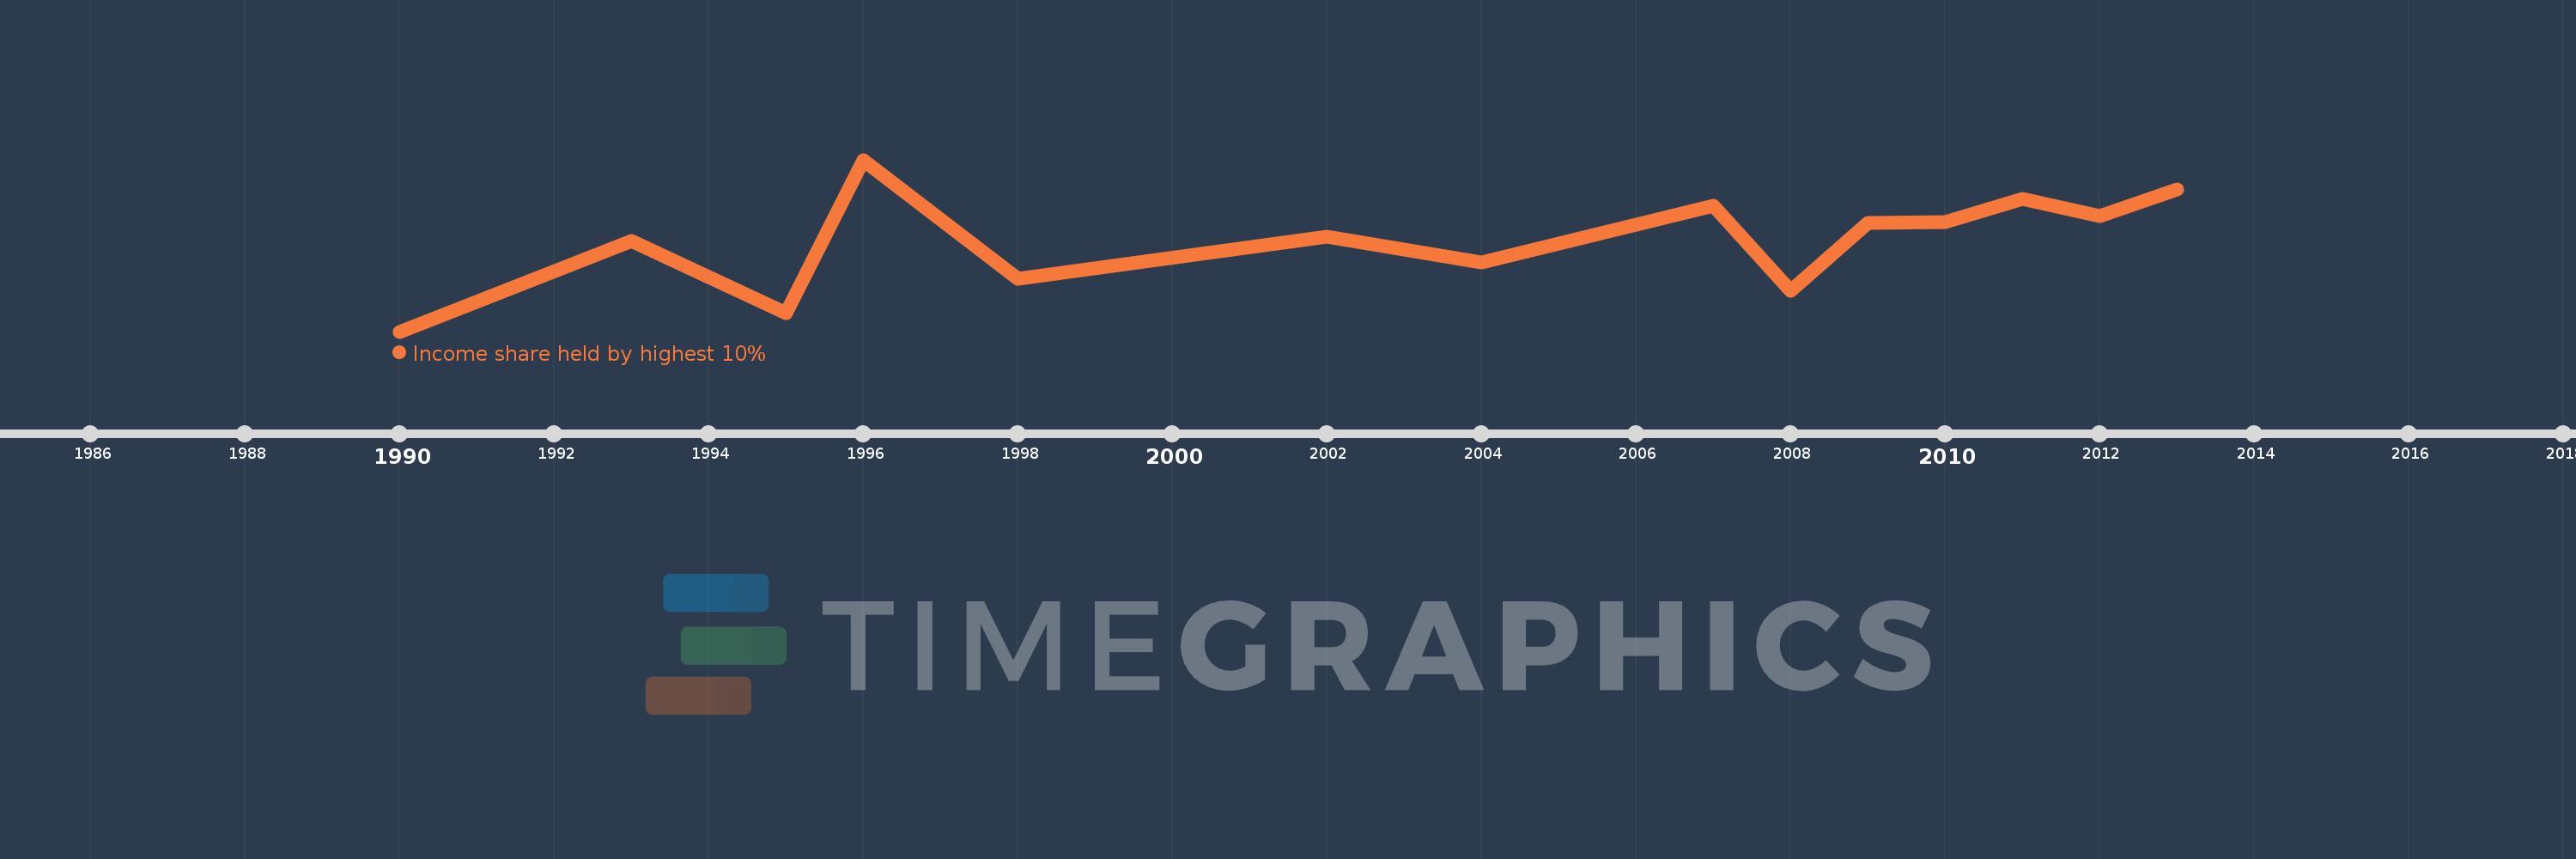
En esta escala de tiempo se presenta un gráfico de 1990 y 2013 de Bulgaria. Los datos de 1989 están ausentes. El número de observaciones reales por fecha: 14.
Fuente (nombre):
Indicadores del desarrollo mundial
Fuente (organización):
World Bank, Development Research Group. Data are based on primary household survey data obtained from government statistical agencies and World Bank country departments. Data for high-income economies are from the Luxembourg Income Study database. For more information and methodology, please see PovcalNet (http://iresearch.worldbank.org/PovcalNet/index.htm).
Categorías:
Poverty
Se ha actualizado:
23 abr 2017 año
Los indicadores de los cambios de valor en los últimos años
En promedio:
24.745
Mínimo:
20.03
1 ene 1990 año
Máximo:
28.93
1 ene 1996 año
A la fecha de observación
Valor
Cambio absoluto
El cambio con respecto al valor anterior
1 ene 1990 año
20.03
+20.03
0.0%
1 ene 1993 año
24.74
+4.71
23.51%
1 ene 1995 año
20.99
-3.75
-15.16%
1 ene 1996 año
28.93
+7.94
37.83%
1 ene 1998 año
22.77
-6.16
-21.29%
1 ene 2002 año
24.93
+2.16
9.49%
1 ene 2004 año
23.63
-1.3
-5.21%
1 ene 2007 año
26.57
+2.94
12.44%
1 ene 2008 año
22.16
-4.41
-16.6%
1 ene 2009 año
25.67
+3.51
15.84%
1 ene 2010 año
25.69
+0.02
0.08%
1 ene 2011 año
26.91
+1.22
4.75%
1 ene 2012 año
26.03
-0.88
-3.27%
1 ene 2013 año
27.38
+1.35
5.19%
Ranking de los países por los datos estadísticos actuales