29
/es/
es
AIzaSyAYiBZKx7MnpbEhh9jyipgxe19OcubqV5w
April 1, 2024
90256
Botswana
BWA
true
2
1
Percentage of teachers in secondary education who are trained, both sexes (%)
2014,2008,2007,2006,2005,2004,2003,2002,2001,2000,1999
Download
Estadísticas Globales de la Biblioteca →Botswana →

Percentage of teachers in secondary education who are trained, both sexes (%)

Estas estadísticas en otros países:
AndorraAntigua and BarbudaArab WorldArubaBahamas, TheBahrainBangladeshBarbadosBelarusBelizeBeninBermudaBhutanBotswanaBritish Virgin IslandsBrunei DarussalamBurkina FasoBurundiCabo VerdeCambodiaCameroonCaribbean small statesCayman IslandsChadColombiaComorosCongo, Dem. Rep.Congo, Rep.Costa RicaCote d'IvoireCroatiaCubaDjiboutiDominicaDominican RepublicEcuadorEgypt, Arab Rep.El SalvadorEquatorial GuineaEritreaEthiopiaFijiFragile and conflict affected situationsGambia, TheGeorgiaGhanaGibraltarGrenadaGuineaGuyanaHeavily indebted poor countries (HIPC)HondurasHong Kong SAR, ChinaIDA blendIDA onlyIDA totalIran, Islamic Rep.IraqJamaicaKazakhstanKenyaKiribatiKuwaitKyrgyz RepublicLao PDRLatin America & Caribbean Latin America & Caribbean (excluding high income)Latin America & the Caribbean (IDA & IBRD countries)Least developed countries: UN classificationLebanonLesothoLiberiaLow incomeMacao SAR, ChinaMadagascarMalawiMalaysiaMaldivesMaliMauritaniaMauritiusMexicoMiddle East & North AfricaMiddle East & North Africa (excluding high income)Middle East & North Africa (IDA & IBRD countries)MongoliaMozambiqueMyanmarNamibiaNauruNepalNicaraguaNigerNigeriaOmanOther small statesPacific island small statesPanamaPapua New GuineaParaguayPeruPhilippinesPre-demographic dividendQatarRwandaSao Tome and PrincipeSaudi ArabiaSerbiaSeychellesSierra LeoneSingaporeSmall statesSolomon IslandsSri LankaSt. Kitts and NevisSt. LuciaSt. Vincent and the GrenadinesSub-Saharan Africa Sub-Saharan Africa (excluding high income)Sub-Saharan Africa (IDA & IBRD countries)SudanSurinameSwazilandSyrian Arab RepublicTajikistanTogoTongaTurks and Caicos IslandsUgandaUnited Arab EmiratesUzbekistanWest Bank and GazaZimbabwe
línea de tiempo (timeline):
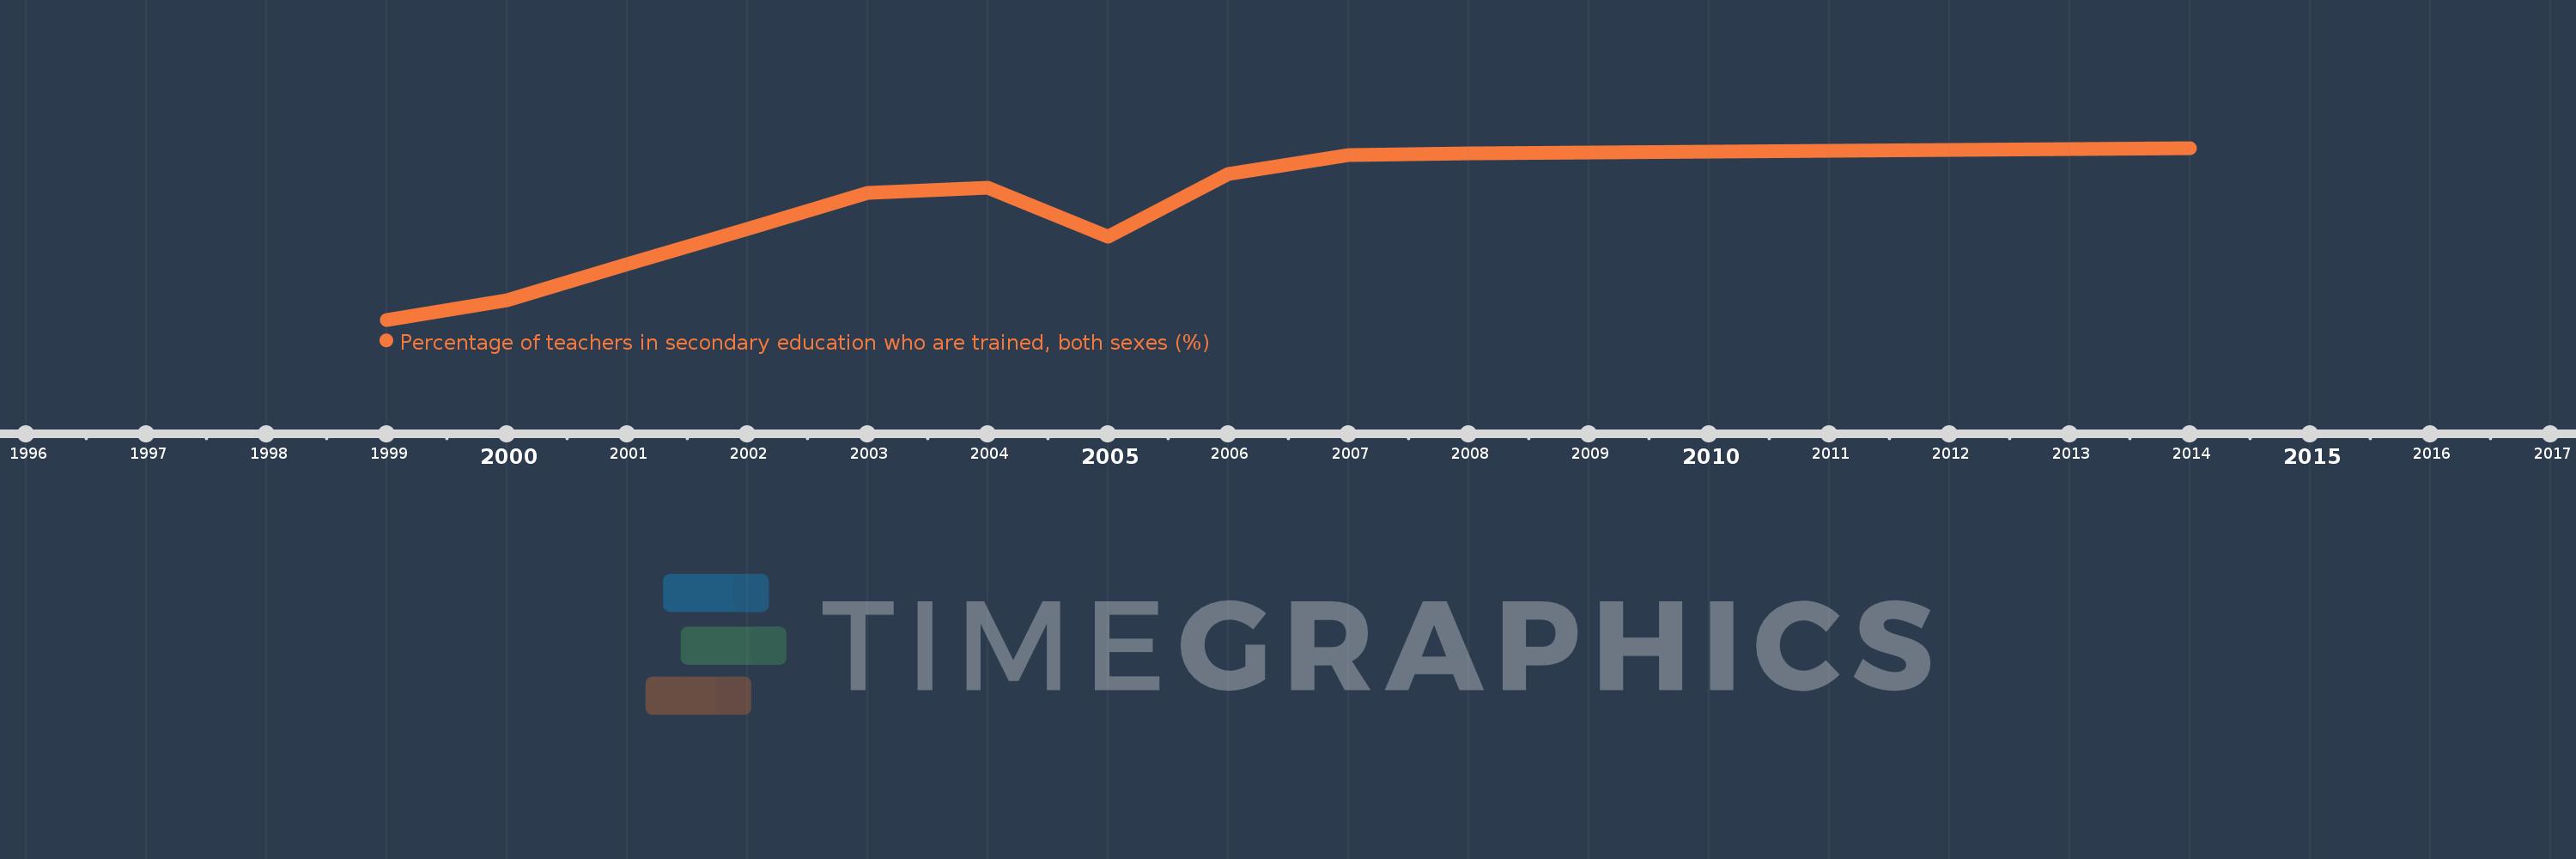
En esta escala de tiempo se presenta un gráfico de 1999 y 2014 de Botswana. Los datos de 1998 están ausentes. El número de observaciones reales por fecha: 11.
Fuente (nombre):
Indicadores del desarrollo mundial
Fuente (organización):
UNESCO Institute for Statistics
Categorías:
Education
Se ha actualizado:
23 abr 2017 año
Los indicadores de los cambios de valor en los últimos años
En promedio:
92.715
Mínimo:
81.764
1 ene 1999 año
Máximo:
99.655
1 ene 2014 año
A la fecha de observación
Valor
Cambio absoluto
El cambio con respecto al valor anterior
1 ene 1999 año
81.764
+81.764
0.0%
1 ene 2000 año
83.796
+2.032
2.49%
1 ene 2001 año
87.523
+3.727
4.45%
1 ene 2002 año
91.239
+3.716
4.25%
1 ene 2003 año
94.964
+3.725
4.08%
1 ene 2004 año
95.557
+0.593
0.62%
1 ene 2005 año
90.373
-5.184
-5.43%
1 ene 2006 año
96.958
+6.586
7.29%
1 ene 2007 año
98.909
+1.951
2.01%
1 ene 2008 año
99.124
+0.215
0.22%
1 ene 2014 año
99.655
+0.531
0.54%
Ranking de los países por los datos estadísticos actuales

Comentarios:

Enviar
PremiumAbout & FeedbackAcuerdoPrivacidad
logo
© 2022 Selected Technologies LLC – Morgan Hill, California