33
/es/
AIzaSyB4mHJ5NPEv-XzF7P6NDYXjlkCWaeKw5bc
November 30, 2025
86190
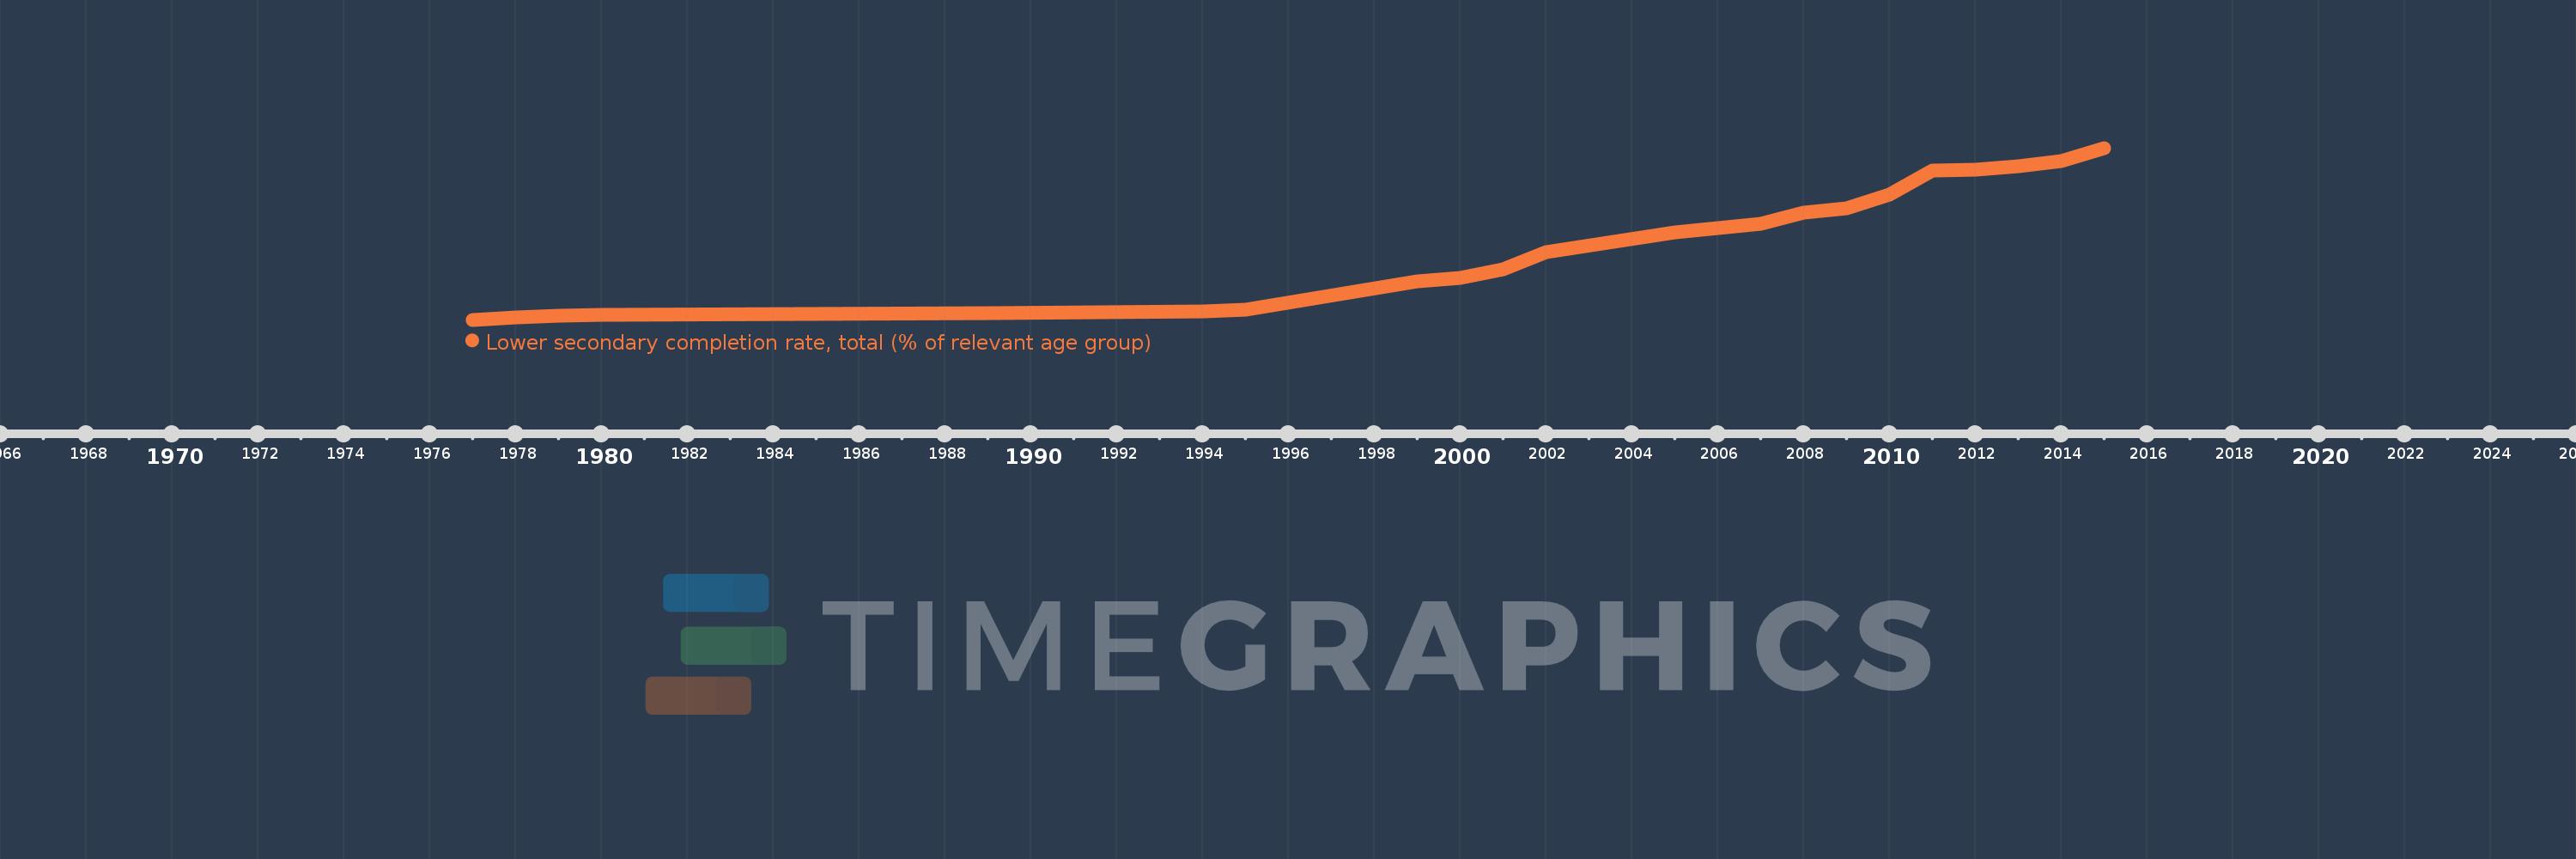
Bhutan
BTN
true
2
1
Lower secondary completion rate, total (% of relevant age group)
2015,2014,2013,2012,2011,2010,2009,2008,2007,2005,2002,2001,2000,1999,1995,1994,1989,1980,1979,1978,1977