29
/es/
es
AIzaSyAYiBZKx7MnpbEhh9jyipgxe19OcubqV5w
April 1, 2024
80920
Belarus
BLR
true
2
1
Net incurrence of liabilities, total (% of GDP)
2016,2015,2014,2013,2012,2011,2010,2009,2008,2007,2006,2005,2004,2003,2002,2001,2000,1999,1998,1997,1996,1995,1994,1993
Download
Estadísticas Globales de la Biblioteca →Belarus →

Net incurrence of liabilities, total (% of GDP)

Estas estadísticas en otros países:
AfghanistanAlbaniaAlgeriaAngolaAntigua and BarbudaArmeniaAustraliaAustriaAzerbaijanBahamas, TheBahrainBangladeshBarbadosBelarusBelgiumBelizeBeninBhutanBoliviaBosnia and HerzegovinaBrazilBurkina FasoBurundiCabo VerdeCambodiaCanadaCentral African RepublicCentral Europe and the BalticsChileChinaColombiaCongo, Dem. Rep.Congo, Rep.Cote d'IvoireCroatiaCyprusCzech RepublicDominicaDominican RepublicEast Asia & Pacific (excluding high income)East Asia & Pacific (IDA & IBRD countries)Egypt, Arab Rep.El SalvadorEquatorial GuineaEstoniaEthiopiaEuro areaEurope & Central AsiaEurope & Central Asia (excluding high income)Europe & Central Asia (IDA & IBRD countries)European UnionFijiFinlandFranceGeorgiaGermanyGhanaGreeceGuatemalaHigh incomeHondurasHong Kong SAR, ChinaHungaryIBRD onlyIcelandIDA & IBRD totalIndiaIndonesiaIran, Islamic Rep.IraqIrelandIsraelItalyJamaicaJapanJordanKazakhstanKiribatiKorea, Rep.Kyrgyz RepublicLao PDRLate-demographic dividendLebanonLesothoLithuaniaLow & middle incomeLow incomeLower middle incomeLuxembourgMacedonia, FYRMadagascarMalawiMalaysiaMaldivesMaliMaltaMauritiusMicronesia, Fed. Sts.Middle East & North Africa (excluding high income)Middle East & North Africa (IDA & IBRD countries)Middle incomeMoldovaMongoliaMoroccoMozambiqueNamibiaNepalNetherlandsNew ZealandNigeriaNorth AmericaNorwayOECD membersOmanPacific island small statesParaguayPeruPhilippinesPolandPortugalPost-demographic dividendRomaniaRussian FederationRwandaSamoaSan MarinoSao Tome and PrincipeSenegalSerbiaSeychellesSierra LeoneSingaporeSlovak RepublicSolomon IslandsSouth AfricaSouth AsiaSouth Asia (IDA & IBRD)SpainSri LankaSt. Kitts and NevisSub-Saharan Africa Sub-Saharan Africa (excluding high income)Sub-Saharan Africa (IDA & IBRD countries)SurinameSwazilandSwedenSwitzerlandSyrian Arab RepublicTanzaniaThailandTogoTrinidad and TobagoTurkeyUgandaUkraineUnited Arab EmiratesUnited KingdomUnited StatesUpper middle incomeUruguayVanuatuVietnamWest Bank and GazaZimbabwe
línea de tiempo (timeline):
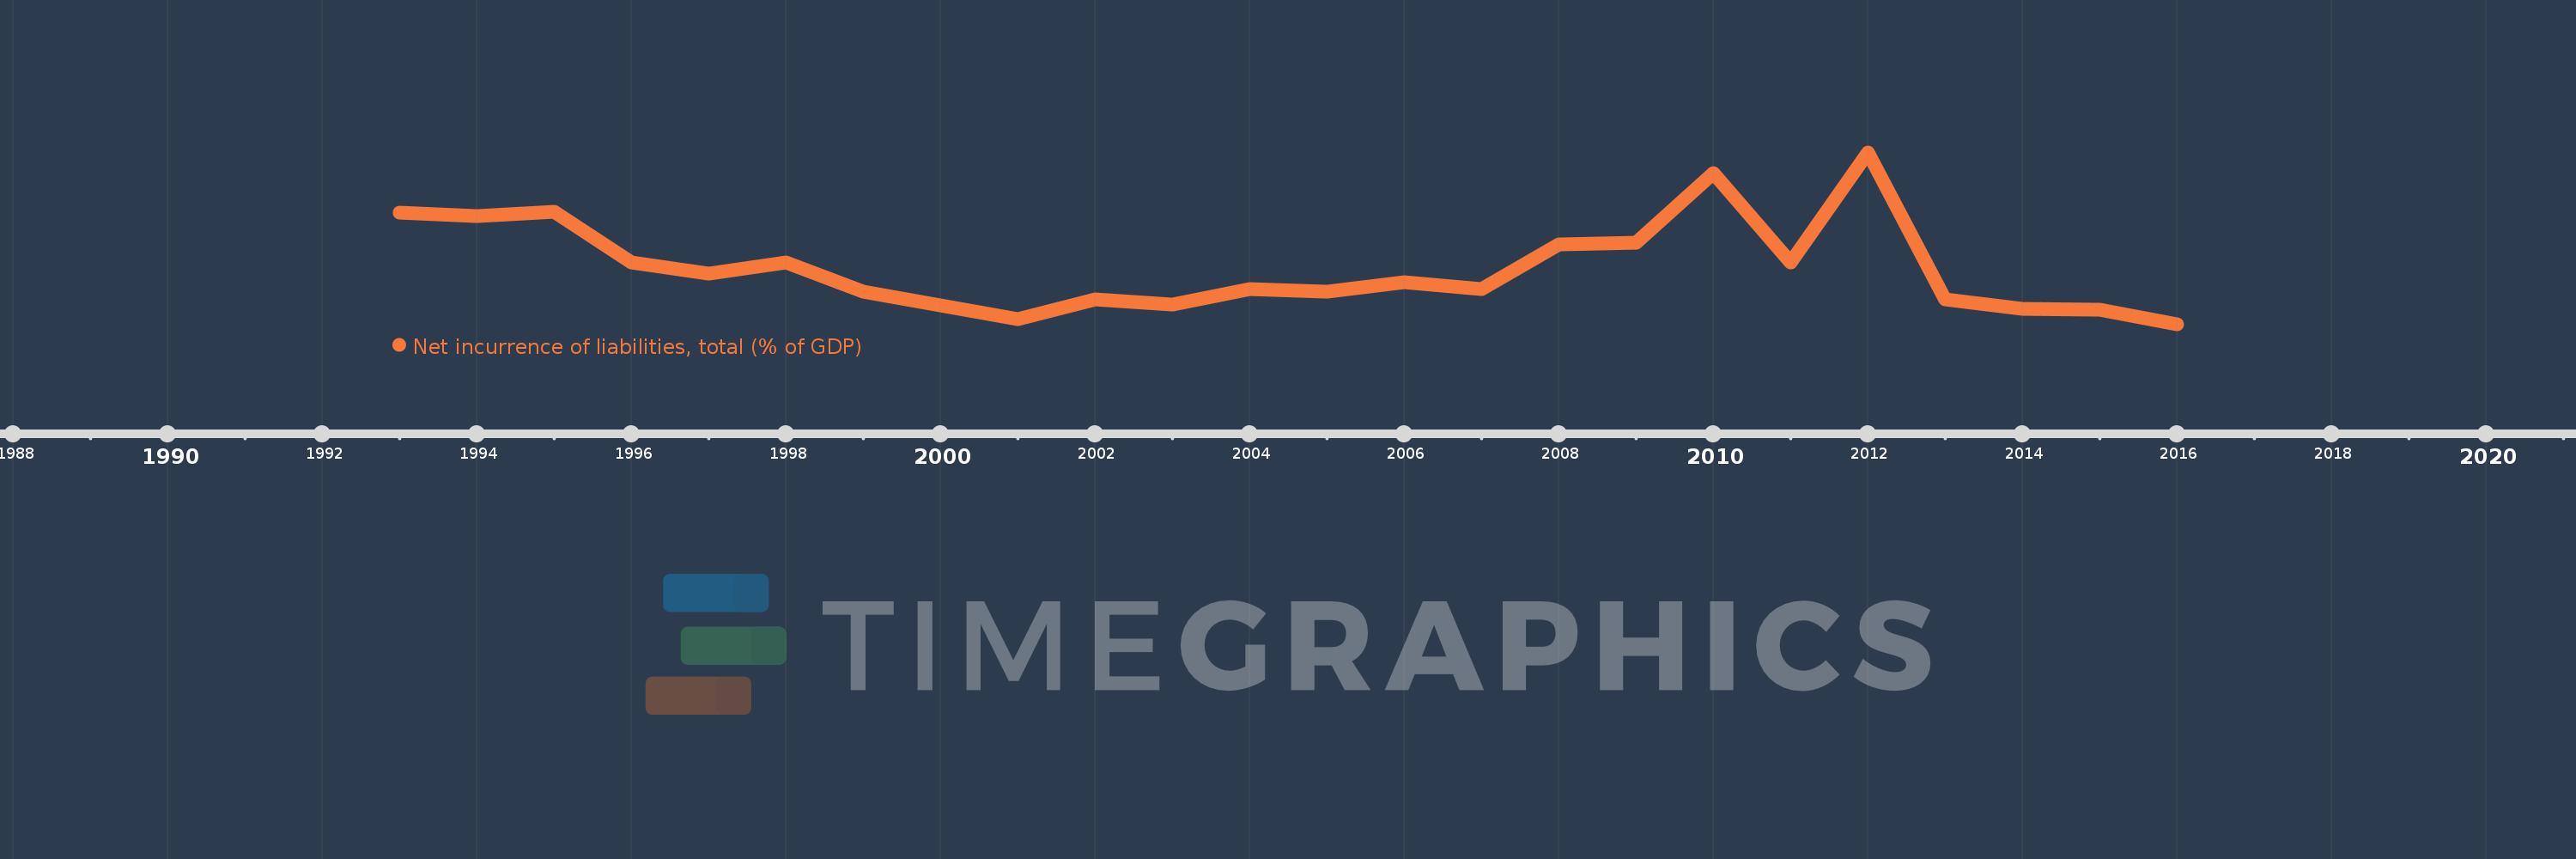
En esta escala de tiempo se presenta un gráfico de 1993 y 2016 de Belarus. Los datos de 1992 están ausentes. El número de observaciones reales por fecha: 24.
Fuente (nombre):
Indicadores del desarrollo mundial
Fuente (organización):
International Monetary Fund, Government Finance Statistics Yearbook and data files.
Categorías:
Public Sector
Se ha actualizado:
23 abr 2017 año
Los indicadores de los cambios de valor en los últimos años
En promedio:
2.314
Mínimo:
-0.503
1 ene 2016 año
Máximo:
8.079
1 ene 2012 año
A la fecha de observación
Valor
Cambio absoluto
El cambio con respecto al valor anterior
1 ene 1993 año
5.084
+5.084
0.0%
1 ene 1994 año
4.912
-0.172
-3.38%
1 ene 1995 año
5.115
+0.203
4.14%
1 ene 1996 año
2.571
-2.545
-49.74%
1 ene 1997 año
2.018
-0.553
-21.51%
1 ene 1998 año
2.597
+0.579
28.71%
1 ene 1999 año
1.144
-1.453
-55.95%
1 ene 2000 año
0.446
-0.699
-61.05%
1 ene 2001 año
-0.264
-0.71
-159.26%
1 ene 2002 año
0.723
+0.987
-373.65%
1 ene 2003 año
0.474
-0.248
-34.37%
1 ene 2004 año
1.254
+0.78
164.36%
1 ene 2005 año
1.118
-0.135
-10.81%
1 ene 2006 año
1.606
+0.488
43.61%
1 ene 2007 año
1.25
-0.356
-22.15%
1 ene 2008 año
3.468
+2.217
177.33%
1 ene 2009 año
3.583
+0.115
3.32%
1 ene 2010 año
7.035
+3.452
96.36%
1 ene 2011 año
2.571
-4.464
-63.45%
1 ene 2012 año
8.079
+5.508
214.2%
1 ene 2013 año
0.739
-7.34
-90.85%
1 ene 2014 año
0.283
-0.456
-61.65%
1 ene 2015 año
0.238
-0.046
-16.09%
1 ene 2016 año
-0.503
-0.741
-311.58%
Ranking de los países por los datos estadísticos actuales

Comentarios:

Enviar
PremiumAbout & FeedbackAcuerdoPrivacidad
logo
© 2022 Selected Technologies LLC – Morgan Hill, California