33
/es/
AIzaSyAYiBZKx7MnpbEhh9jyipgxe19OcubqV5w
August 1, 2025
67753
Angola
AGO
true
2
1
GDP per capita (current US$)
2016,2015,2014,2013,2012,2011,2010,2009,2008,2007,2006,2005,2004,2003,2002,2001,2000,1999,1998,1997,1996,1995,1991,1990,1989,1988,1987,1986
Download
Estadísticas Globales de la Biblioteca →Angola →

GDP per capita (current US$)

Estas estadísticas en otros países:

AfghanistanAlbaniaAlgeriaAndorraAngolaAntigua and BarbudaArab WorldArgentinaArmeniaArubaAustraliaAustriaAzerbaijanBahamas, TheBahrainBangladeshBarbadosBelarusBelgiumBelizeBeninBermudaBhutanBoliviaBosnia and HerzegovinaBotswanaBrazilBrunei DarussalamBulgariaBurkina FasoBurundiCabo VerdeCambodiaCameroonCanadaCaribbean small statesCayman IslandsCentral African RepublicCentral Europe and the BalticsChadChannel IslandsChileChinaColombiaComorosCongo, Dem. Rep.Congo, Rep.Costa RicaCote d'IvoireCroatiaCubaCyprusCzech RepublicDenmarkDjiboutiDominicaDominican RepublicEarly-demographic dividendEast Asia & PacificEast Asia & Pacific (excluding high income)East Asia & Pacific (IDA & IBRD countries)EcuadorEgypt, Arab Rep.El SalvadorEquatorial GuineaEritreaEstoniaEthiopiaEuro areaEurope & Central AsiaEurope & Central Asia (excluding high income)Europe & Central Asia (IDA & IBRD countries)European UnionFaroe IslandsFijiFinlandFragile and conflict affected situationsFranceFrench PolynesiaGabonGambia, TheGeorgiaGermanyGhanaGreeceGreenlandGrenadaGuatemalaGuineaGuinea-BissauGuyanaHaitiHeavily indebted poor countries (HIPC)High incomeHondurasHong Kong SAR, ChinaHungaryIBRD onlyIcelandIDA & IBRD totalIDA blendIDA onlyIDA totalIndiaIndonesiaIran, Islamic Rep.IraqIrelandIsle of ManIsraelItalyJamaicaJapanJordanKazakhstanKenyaKiribatiKorea, Rep.KosovoKuwaitKyrgyz RepublicLao PDRLate-demographic dividendLatin America & Caribbean Latin America & Caribbean (excluding high income)Latin America & the Caribbean (IDA & IBRD countries)LatviaLeast developed countries: UN classificationLebanonLesothoLiberiaLibyaLiechtensteinLithuaniaLow & middle incomeLow incomeLower middle incomeLuxembourgMacao SAR, ChinaMacedonia, FYRMadagascarMalawiMalaysiaMaldivesMaliMaltaMarshall IslandsMauritaniaMauritiusMexicoMicronesia, Fed. Sts.Middle East & North AfricaMiddle East & North Africa (excluding high income)Middle East & North Africa (IDA & IBRD countries)Middle incomeMoldovaMonacoMongoliaMontenegroMoroccoMozambiqueMyanmarNamibiaNauruNepalNetherlandsNew CaledoniaNew ZealandNicaraguaNigerNigeriaNorth AmericaNorwayOECD membersOmanOther small statesPacific island small statesPakistanPalauPanamaPapua New GuineaParaguayPeruPhilippinesPolandPortugalPost-demographic dividendPre-demographic dividendPuerto RicoQatarRomaniaRussian FederationRwandaSamoaSan MarinoSao Tome and PrincipeSaudi ArabiaSenegalSerbiaSeychellesSierra LeoneSingaporeSlovak RepublicSloveniaSmall statesSolomon IslandsSomaliaSouth AfricaSouth AsiaSouth Asia (IDA & IBRD)South SudanSpainSri LankaSt. Kitts and NevisSt. LuciaSt. Vincent and the GrenadinesSub-Saharan Africa Sub-Saharan Africa (excluding high income)Sub-Saharan Africa (IDA & IBRD countries)SudanSurinameSwazilandSwedenSwitzerlandSyrian Arab RepublicTajikistanTanzaniaThailandTimor-LesteTogoTongaTrinidad and TobagoTunisiaTurkeyTurkmenistanTuvaluUgandaUkraineUnited Arab EmiratesUnited KingdomUnited StatesUpper middle incomeUruguayUzbekistanVanuatuVenezuela, RBVietnamVirgin Islands (U.S.)West Bank and GazaWorldYemen, Rep.ZambiaZimbabwe

línea de tiempo (timeline):

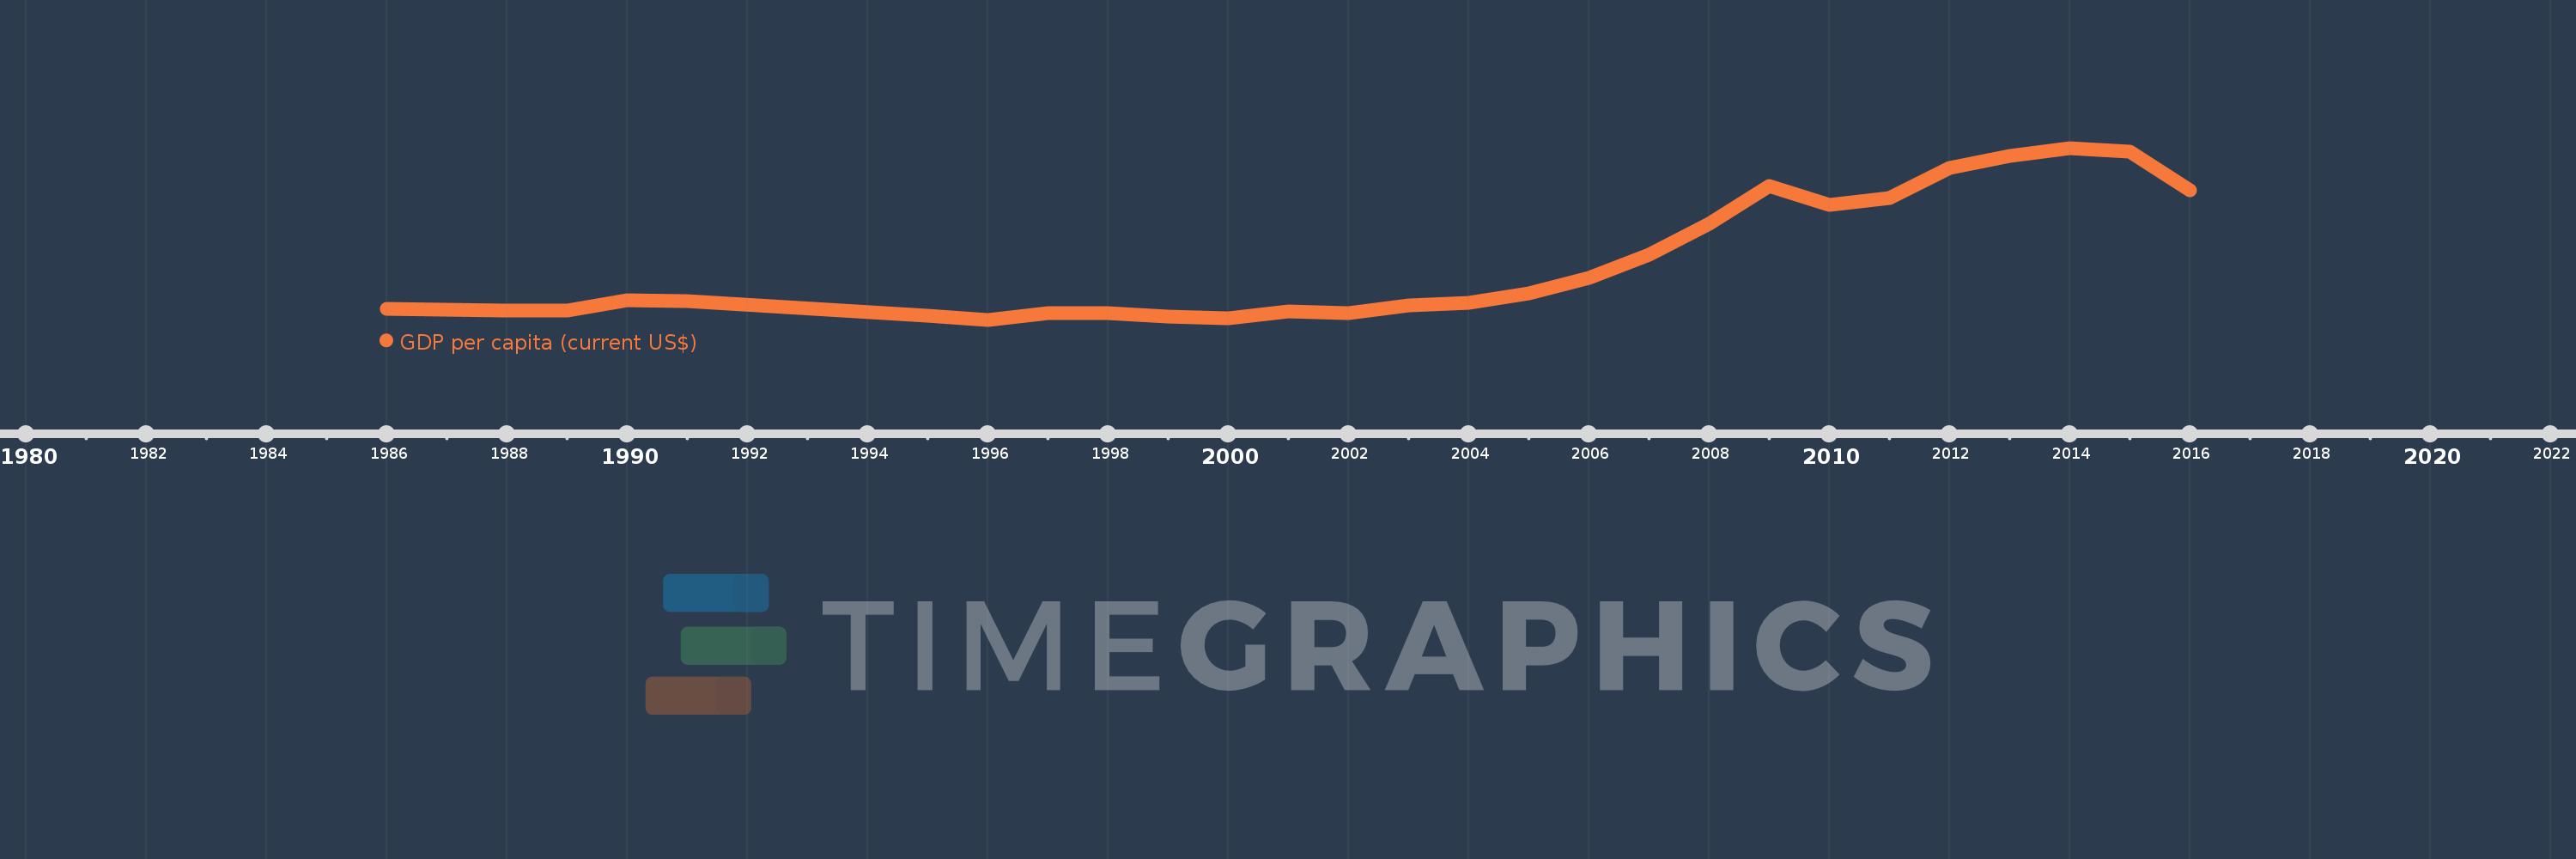
En esta escala de tiempo se presenta un gráfico de 1986 y 2016 de Angola. Los datos de 1985 están ausentes. El número de observaciones reales por fecha: 28.

Fuente (nombre):

Indicadores del desarrollo mundial

Fuente (organización):

World Bank national accounts data, and OECD National Accounts data files.

Categorías:

Economy & Growth

Se ha actualizado:

23 abr 2017 año

Los indicadores de los cambios de valor en los últimos años

En promedio:
1.948 mil
Mínimo:
374.102
1 ene 1996 año
Máximo:
5.327 mil
1 ene 2014 año
A la fecha de observación
Valor
Cambio absoluto
El cambio con respecto al valor anterior
1 ene 1986 año
686.385
+686.385
0.0%
1 ene 1987 año
667.315
-19.07
-2.78%
1 ene 1988 año
650.316
-16.999
-2.55%
1 ene 1989 año
634.331
-15.985
-2.46%
1 ene 1990 año
927.22
+292.889
46.17%
1 ene 1991 año
901.65
-25.57
-2.76%
1 ene 1995 año
490.335
-411.315
-45.62%
1 ene 1996 año
374.102
-116.234
-23.7%
1 ene 1997 año
560.676
+186.574
49.87%
1 ene 1998 año
554.252
-6.423
-1.15%
1 ene 1999 año
454.297
-99.956
-18.03%
1 ene 2000 año
421.377
-32.92
-7.25%
1 ene 2001 año
606.272
+184.896
43.88%
1 ene 2002 año
574.194
-32.078
-5.29%
1 ene 2003 año
775.766
+201.571
35.11%
1 ene 2004 año
850.076
+74.31
9.58%
1 ene 2005 año
1.136 mil
+285.529
33.59%
1 ene 2006 año
1.576 mil
+440.558
38.8%
1 ene 2007 año
2.254 mil
+677.676
43.0%
1 ene 2008 año
3.151 mil
+897.184
39.81%
1 ene 2009 año
4.242 mil
+1.091 mil
34.63%
1 ene 2010 año
3.679 mil
-563.415
-13.28%
1 ene 2011 año
3.886 mil
+207.532
5.64%
1 ene 2012 año
4.745 mil
+858.508
22.09%
1 ene 2013 año
5.087 mil
+341.861
7.2%
1 ene 2014 año
5.327 mil
+240.3
4.72%
1 ene 2015 año
5.233 mil
-94.387
-1.77%
1 ene 2016 año
4.101 mil
-1.131 mil
-21.62%

Ranking de los países por los datos estadísticos actuales