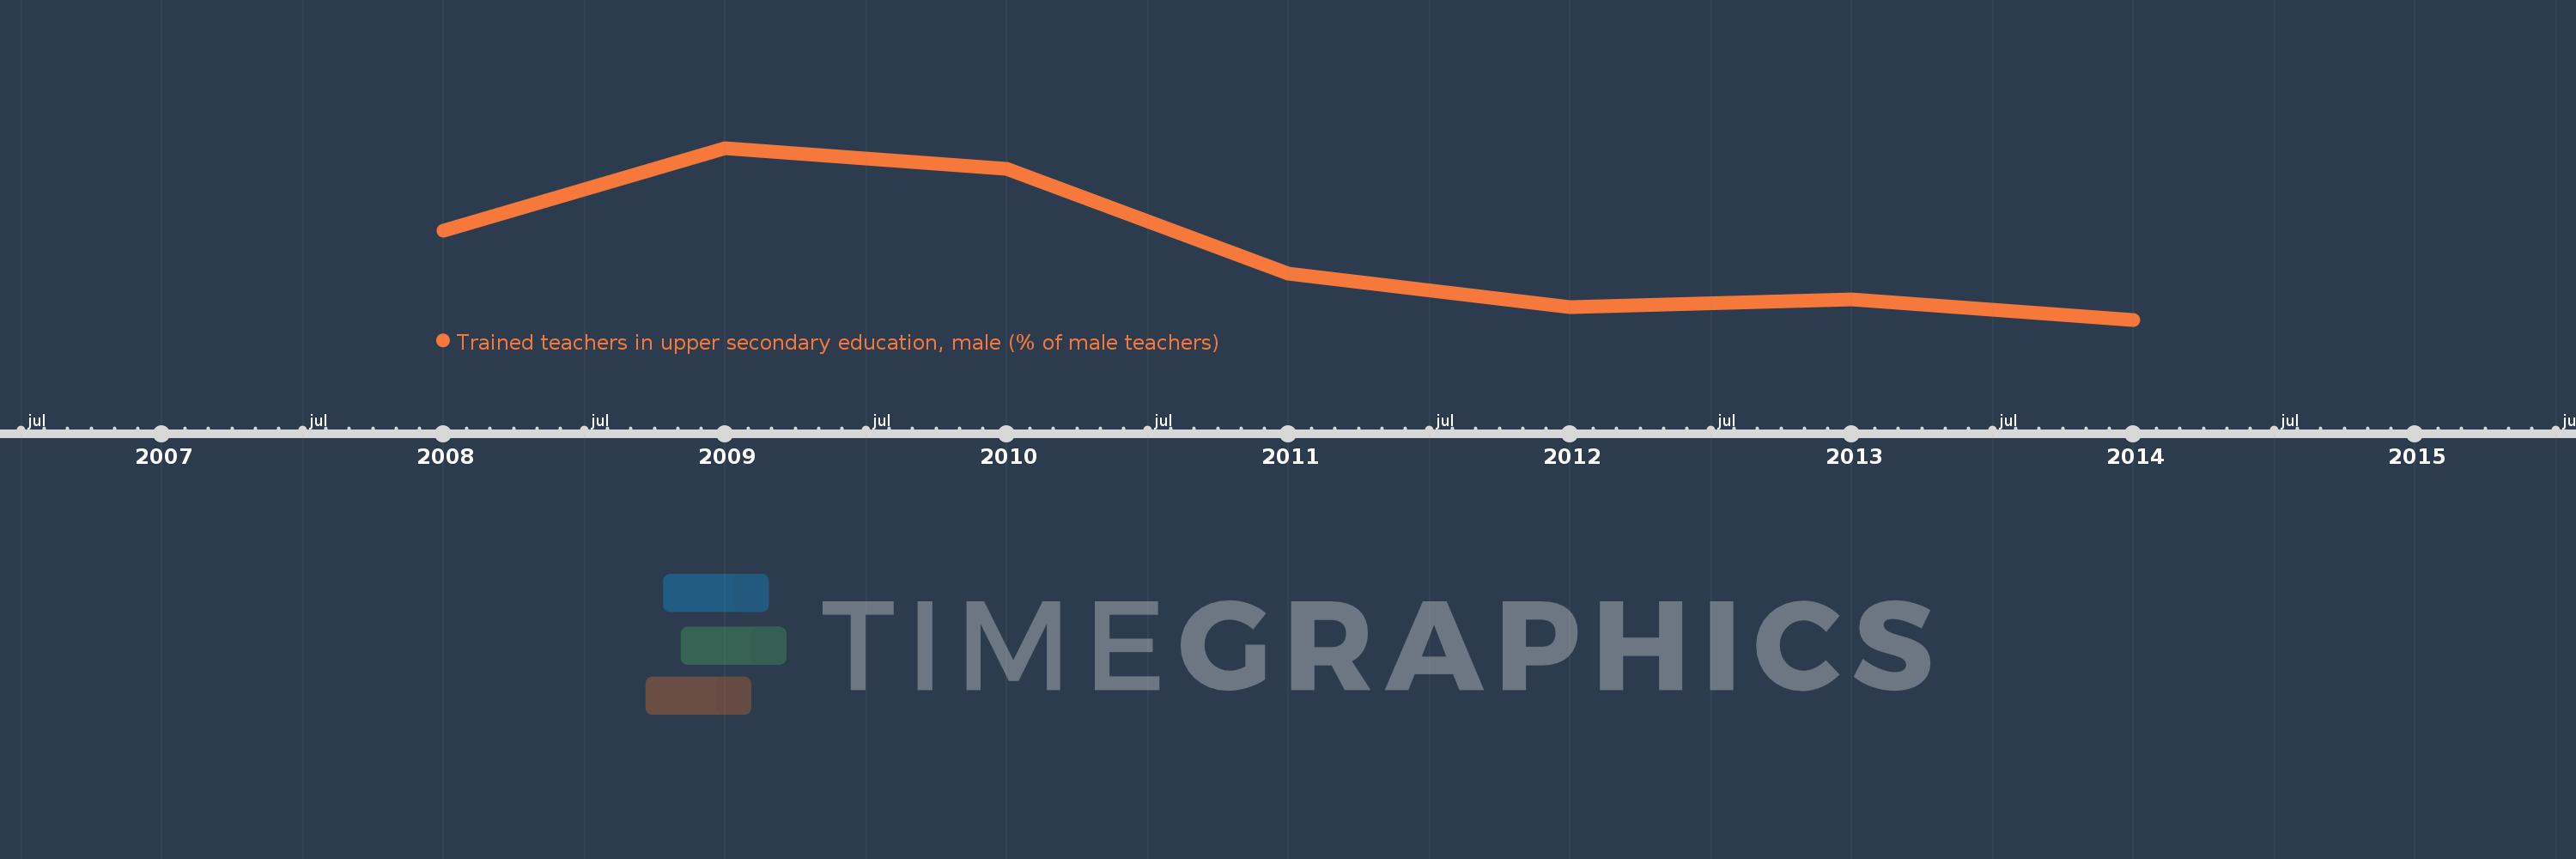
En esta escala de tiempo se presenta un gráfico de 2008 y 2014 de Sub-Saharan Africa (excluding high income). Los datos de 2007 están ausentes. El número de observaciones reales por fecha: 7.
Fuente (nombre):
Indicadores del desarrollo mundial
Fuente (organización):
United Nations Educational, Scientific, and Cultural Organization (UNESCO) Institute for Statistics.
Categorías:
Education
Se ha actualizado:
23 abr 2017 año
Los indicadores de los cambios de valor en los últimos años
En promedio:
54.845
Mínimo:
47.477
1 ene 2014 año
Máximo:
65.539
1 ene 2009 año
A la fecha de observación
Valor
Cambio absoluto
El cambio con respecto al valor anterior
1 ene 2008 año
56.799
+56.799
0.0%
1 ene 2009 año
65.539
+8.74
15.39%
1 ene 2010 año
63.338
-2.201
-3.36%
1 ene 2011 año
52.323
-11.015
-17.39%
1 ene 2012 año
48.8
-3.523
-6.73%
1 ene 2013 año
49.641
+0.841
1.72%
1 ene 2014 año
47.477
-2.164
-4.36%
Ranking de los países por los datos estadísticos actuales