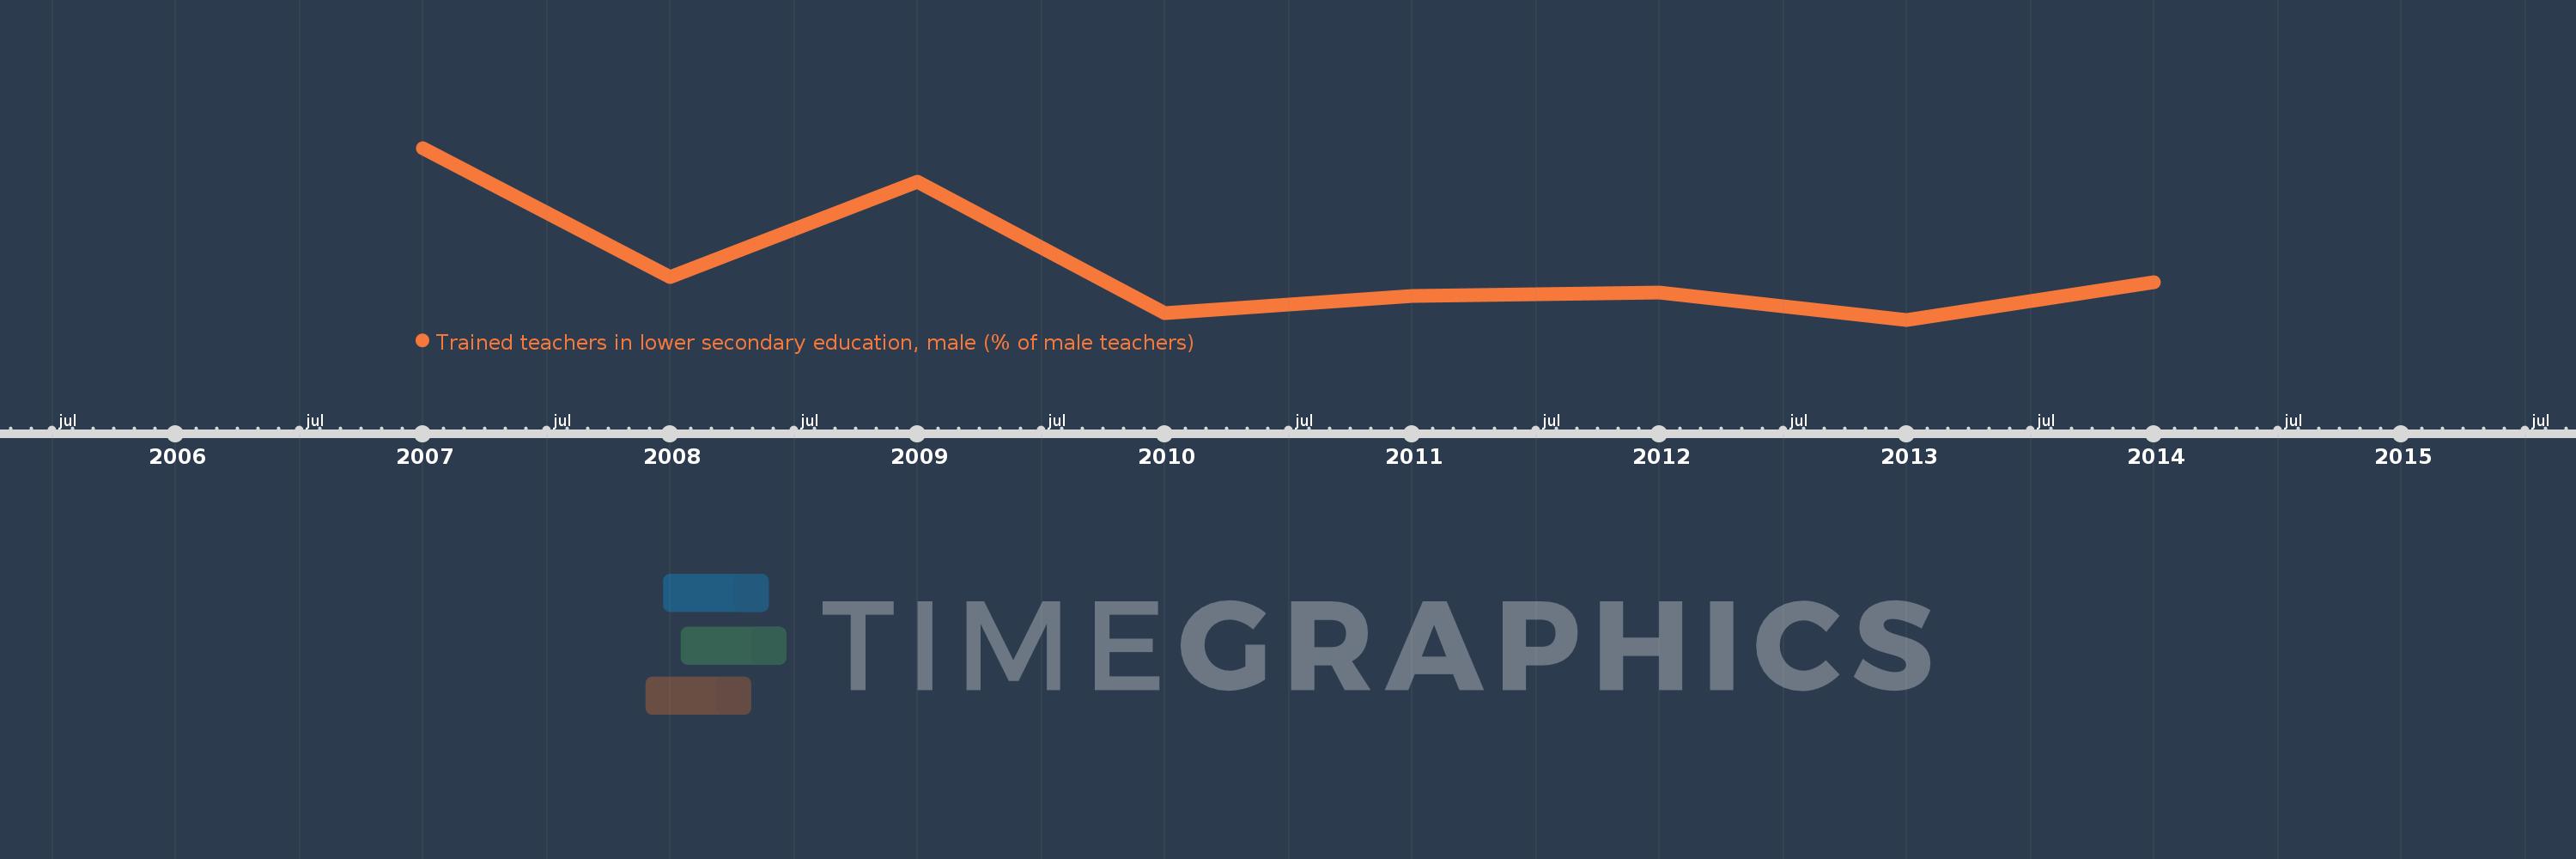
En esta escala de tiempo se presenta un gráfico de 2007 y 2014 de Sub-Saharan Africa (excluding high income). Los datos de 2006 están ausentes. El número de observaciones reales por fecha: 8.
Fuente (nombre):
Indicadores del desarrollo mundial
Fuente (organización):
United Nations Educational, Scientific, and Cultural Organization (UNESCO) Institute for Statistics.
Categorías:
Education
Se ha actualizado:
23 abr 2017 año
Los indicadores de los cambios de valor en los últimos años
En promedio:
62.734
Mínimo:
59.482
1 ene 2013 año
Máximo:
69.449
1 ene 2007 año
A la fecha de observación
Valor
Cambio absoluto
El cambio con respecto al valor anterior
1 ene 2007 año
69.449
+69.449
0.0%
1 ene 2008 año
61.968
-7.482
-10.77%
1 ene 2009 año
67.474
+5.506
8.89%
1 ene 2010 año
59.889
-7.585
-11.24%
1 ene 2011 año
60.884
+0.995
1.66%
1 ene 2012 año
61.063
+0.178
0.29%
1 ene 2013 año
59.482
-1.58
-2.59%
1 ene 2014 año
61.666
+2.183
3.67%
Ranking de los países por los datos estadísticos actuales