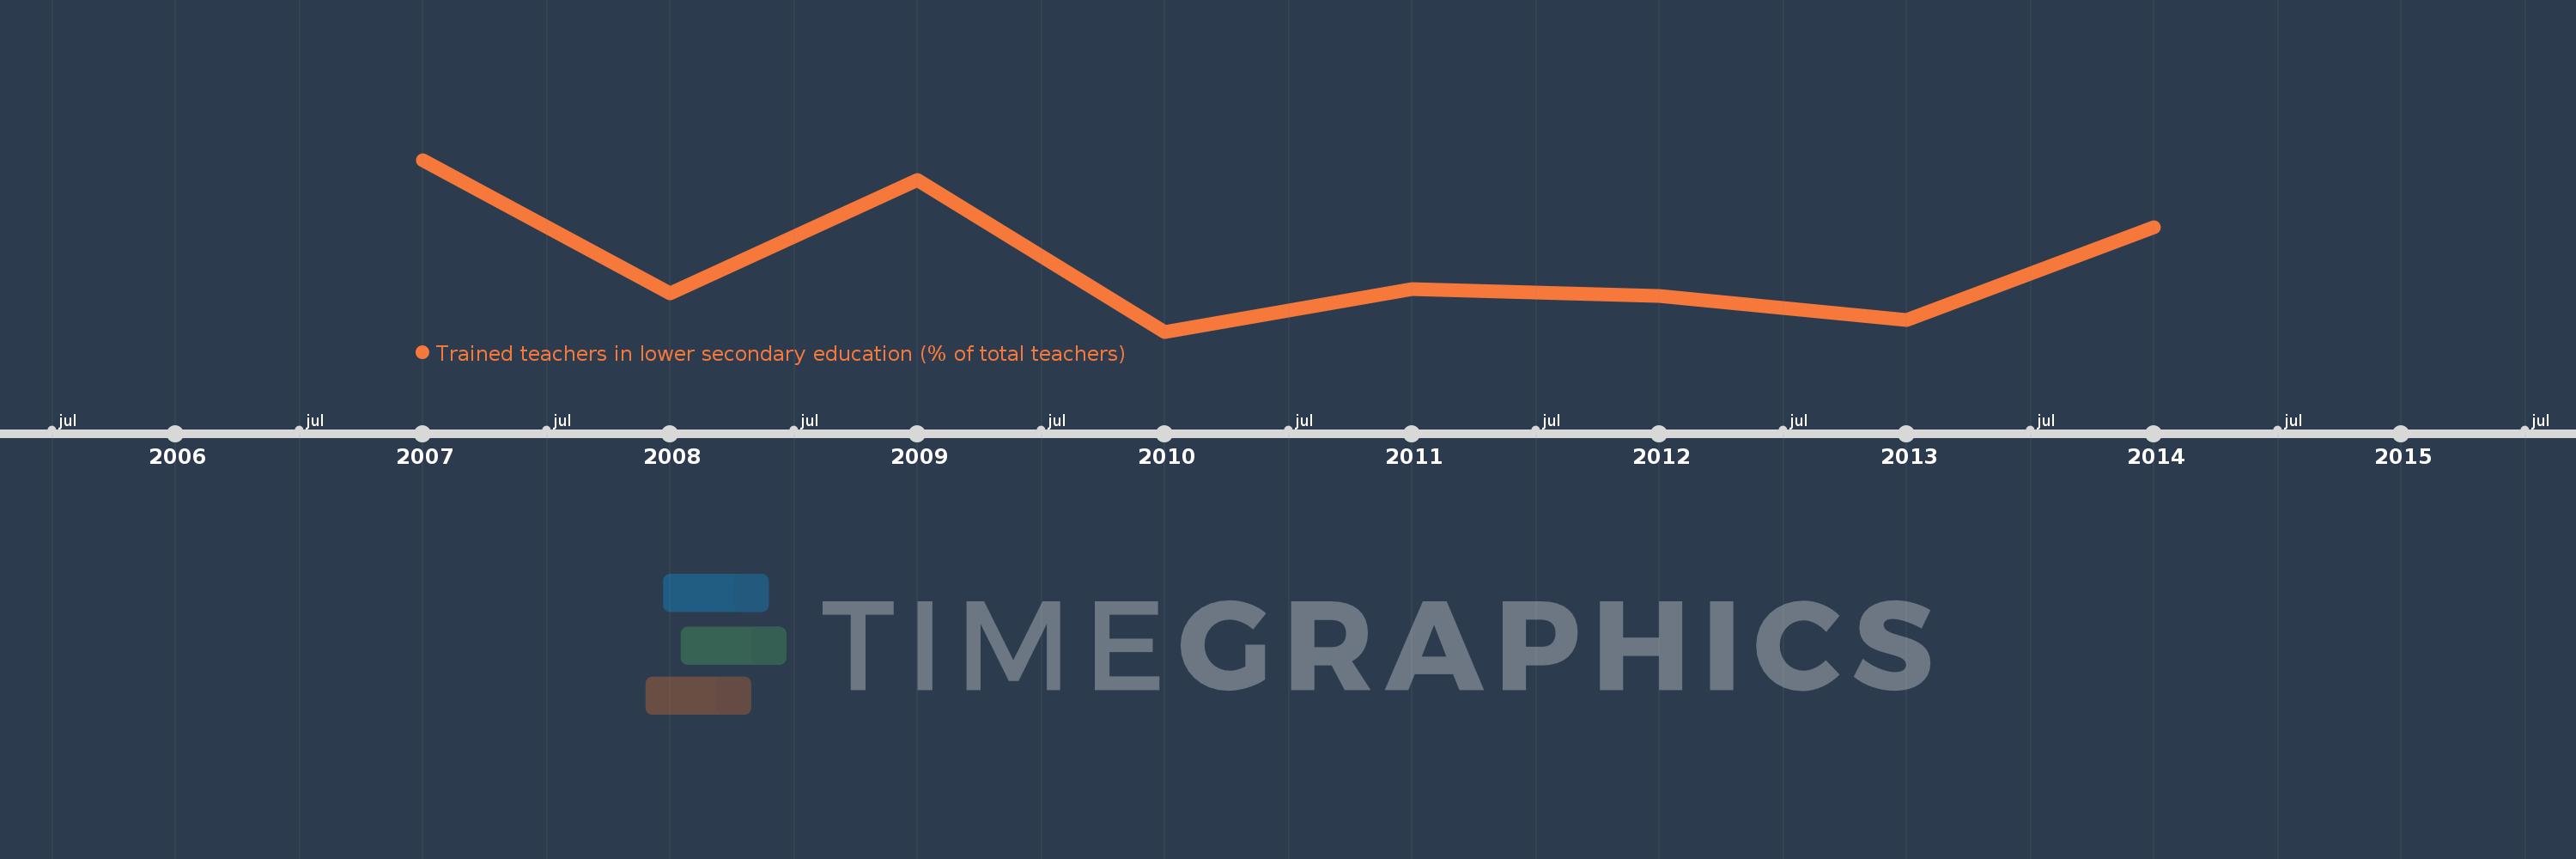
En esta escala de tiempo se presenta un gráfico de 2007 y 2014 de Sub-Saharan Africa (excluding high income). Los datos de 2006 están ausentes. El número de observaciones reales por fecha: 8.
Fuente (nombre):
Indicadores del desarrollo mundial
Fuente (organización):
United Nations Educational, Scientific, and Cultural Organization (UNESCO) Institute for Statistics.
Categorías:
Education
Se ha actualizado:
23 abr 2017 año
Los indicadores de los cambios de valor en los últimos años
En promedio:
65.565
Mínimo:
61.285
1 ene 2010 año
Máximo:
71.863
1 ene 2007 año
A la fecha de observación
Valor
Cambio absoluto
El cambio con respecto al valor anterior
1 ene 2007 año
71.863
+71.863
0.0%
1 ene 2008 año
63.641
-8.223
-11.44%
1 ene 2009 año
70.623
+6.983
10.97%
1 ene 2010 año
61.285
-9.338
-13.22%
1 ene 2011 año
63.881
+2.596
4.24%
1 ene 2012 año
63.496
-0.386
-0.6%
1 ene 2013 año
61.999
-1.496
-2.36%
1 ene 2014 año
67.728
+5.729
9.24%
Ranking de los países por los datos estadísticos actuales