33
/es/
AIzaSyAYiBZKx7MnpbEhh9jyipgxe19OcubqV5w
August 1, 2025
55831
Pre-demographic dividend
PRE
false
2
1
Primary income payments (BoP, current US$)
2014,2013,2012,2011,2010,2009,2008,2007,2006,1995,1994,1993,1992,1991,1990,1989,1988,1987,1986
Download
Estadísticas Globales de la Biblioteca →Pre-demographic dividend →

Primary income payments (BoP, current US$)

Estas estadísticas en otros países:

AfghanistanAlbaniaAlgeriaAngolaAntigua and BarbudaArab WorldArgentinaArmeniaArubaAustraliaAustriaAzerbaijanBahamas, TheBahrainBangladeshBarbadosBelarusBelgiumBelizeBeninBermudaBhutanBoliviaBosnia and HerzegovinaBotswanaBrazilBrunei DarussalamBulgariaBurkina FasoBurundiCabo VerdeCambodiaCameroonCanadaCaribbean small statesCentral African RepublicCentral Europe and the BalticsChadChileChinaColombiaComorosCongo, Dem. Rep.Congo, Rep.Costa RicaCote d'IvoireCroatiaCuracaoCyprusCzech RepublicDenmarkDjiboutiDominicaDominican RepublicEarly-demographic dividendEast Asia & PacificEast Asia & Pacific (excluding high income)East Asia & Pacific (IDA & IBRD countries)EcuadorEgypt, Arab Rep.El SalvadorEquatorial GuineaEritreaEstoniaEthiopiaEuro areaEurope & Central AsiaEurope & Central Asia (excluding high income)Europe & Central Asia (IDA & IBRD countries)European UnionFaroe IslandsFijiFinlandFragile and conflict affected situationsFranceFrench PolynesiaGabonGambia, TheGeorgiaGermanyGhanaGreeceGrenadaGuatemalaGuineaGuinea-BissauGuyanaHaitiHeavily indebted poor countries (HIPC)High incomeHondurasHong Kong SAR, ChinaHungaryIBRD onlyIcelandIDA & IBRD totalIDA blendIDA onlyIDA totalIndiaIndonesiaIran, Islamic Rep.IraqIrelandIsraelItalyJamaicaJapanJordanKazakhstanKenyaKiribatiKorea, Rep.KosovoKuwaitKyrgyz RepublicLao PDRLate-demographic dividendLatin America & Caribbean Latin America & Caribbean (excluding high income)Latin America & the Caribbean (IDA & IBRD countries)LatviaLeast developed countries: UN classificationLebanonLesothoLiberiaLibyaLithuaniaLow & middle incomeLow incomeLower middle incomeLuxembourgMacao SAR, ChinaMacedonia, FYRMadagascarMalawiMalaysiaMaldivesMaliMaltaMarshall IslandsMauritaniaMauritiusMexicoMicronesia, Fed. Sts.Middle East & North AfricaMiddle East & North Africa (excluding high income)Middle East & North Africa (IDA & IBRD countries)Middle incomeMoldovaMongoliaMontenegroMoroccoMozambiqueMyanmarNamibiaNepalNetherlandsNew CaledoniaNew ZealandNicaraguaNigerNigeriaNorth AmericaNorwayOECD membersOmanOther small statesPacific island small statesPakistanPalauPanamaPapua New GuineaParaguayPeruPhilippinesPolandPortugalPost-demographic dividendPre-demographic dividendQatarRomaniaRussian FederationRwandaSamoaSao Tome and PrincipeSaudi ArabiaSenegalSerbiaSeychellesSierra LeoneSingaporeSint Maarten (Dutch part)Slovak RepublicSloveniaSmall statesSolomon IslandsSouth AfricaSouth AsiaSouth Asia (IDA & IBRD)South SudanSpainSri LankaSt. Kitts and NevisSt. LuciaSt. Vincent and the GrenadinesSub-Saharan Africa Sub-Saharan Africa (excluding high income)Sub-Saharan Africa (IDA & IBRD countries)SudanSurinameSwazilandSwedenSwitzerlandSyrian Arab RepublicTajikistanTanzaniaThailandTimor-LesteTogoTongaTrinidad and TobagoTunisiaTurkeyTuvaluUgandaUkraineUnited KingdomUnited StatesUpper middle incomeUruguayVanuatuVenezuela, RBVietnamWest Bank and GazaWorldYemen, Rep.ZambiaZimbabwe

línea de tiempo (timeline):

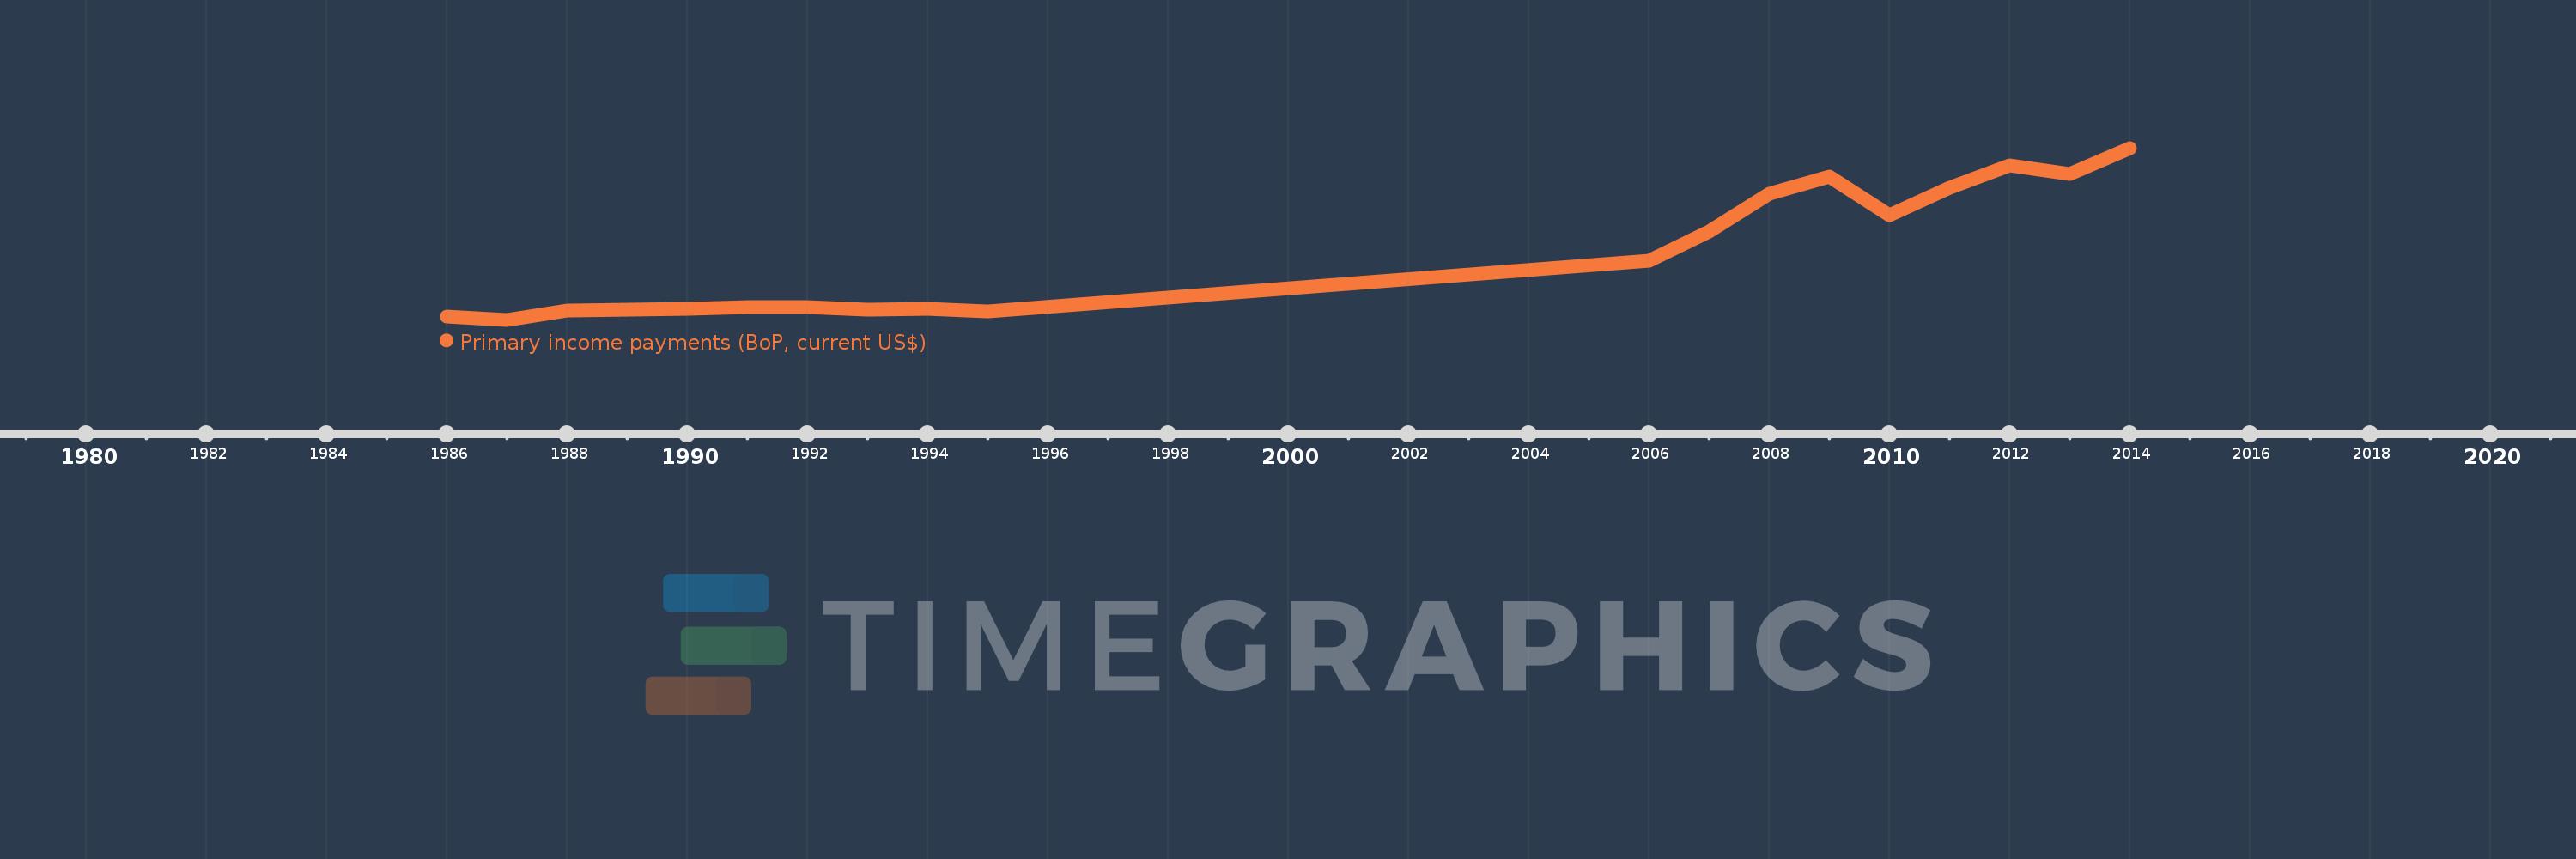
En esta escala de tiempo se presenta un gráfico de 1986 y 2014 de Pre-demographic dividend. Los datos de 1985 están ausentes. El número de observaciones reales por fecha: 19.

Fuente (nombre):

Indicadores del desarrollo mundial

Fuente (organización):

International Monetary Fund, Balance of Payments Statistics Yearbook and data files.

Categorías:

Economy & Growth

Se ha actualizado:

23 abr 2017 año

Los indicadores de los cambios de valor en los últimos años

En promedio:
21.708 bn
Mínimo:
3.383 bn
1 ene 1987 año
Máximo:
52.757 bn
1 ene 2014 año
A la fecha de observación
Valor
Cambio absoluto
El cambio con respecto al valor anterior
1 ene 1986 año
4.269 bn
+4.269 bn
0.0%
1 ene 1987 año
3.383 bn
-886.862 millones
-20.77%
1 ene 1988 año
5.949 bn
+2.566 bn
75.86%
1 ene 1989 año
6.221 bn
+272.468 millones
4.58%
1 ene 1990 año
6.399 bn
+177.411 millones
2.85%
1 ene 1991 año
7.133 bn
+734.189 millones
11.47%
1 ene 1992 año
7.017 bn
-115.571 millones
-1.62%
1 ene 1993 año
6.177 bn
-840.134 millones
-11.97%
1 ene 1994 año
6.523 bn
+345.575 millones
5.59%
1 ene 1995 año
5.658 bn
-864.09 millones
-13.25%
1 ene 2006 año
20.331 bn
+14.672 bn
259.3%
1 ene 2007 año
28.7 bn
+8.369 bn
41.17%
1 ene 2008 año
39.613 bn
+10.913 bn
38.02%
1 ene 2009 año
44.504 bn
+4.892 bn
12.35%
1 ene 2010 año
33.39 bn
-11.115 bn
-24.97%
1 ene 2011 año
41.378 bn
+7.989 bn
23.93%
1 ene 2012 año
47.69 bn
+6.311 bn
15.25%
1 ene 2013 año
45.358 bn
-2.332 bn
-4.89%
1 ene 2014 año
52.757 bn
+7.399 bn
16.31%

Ranking de los países por los datos estadísticos actuales