33
/es/
AIzaSyB4mHJ5NPEv-XzF7P6NDYXjlkCWaeKw5bc
November 30, 2025
54281
Pacific island small states
PSS
false
2
1
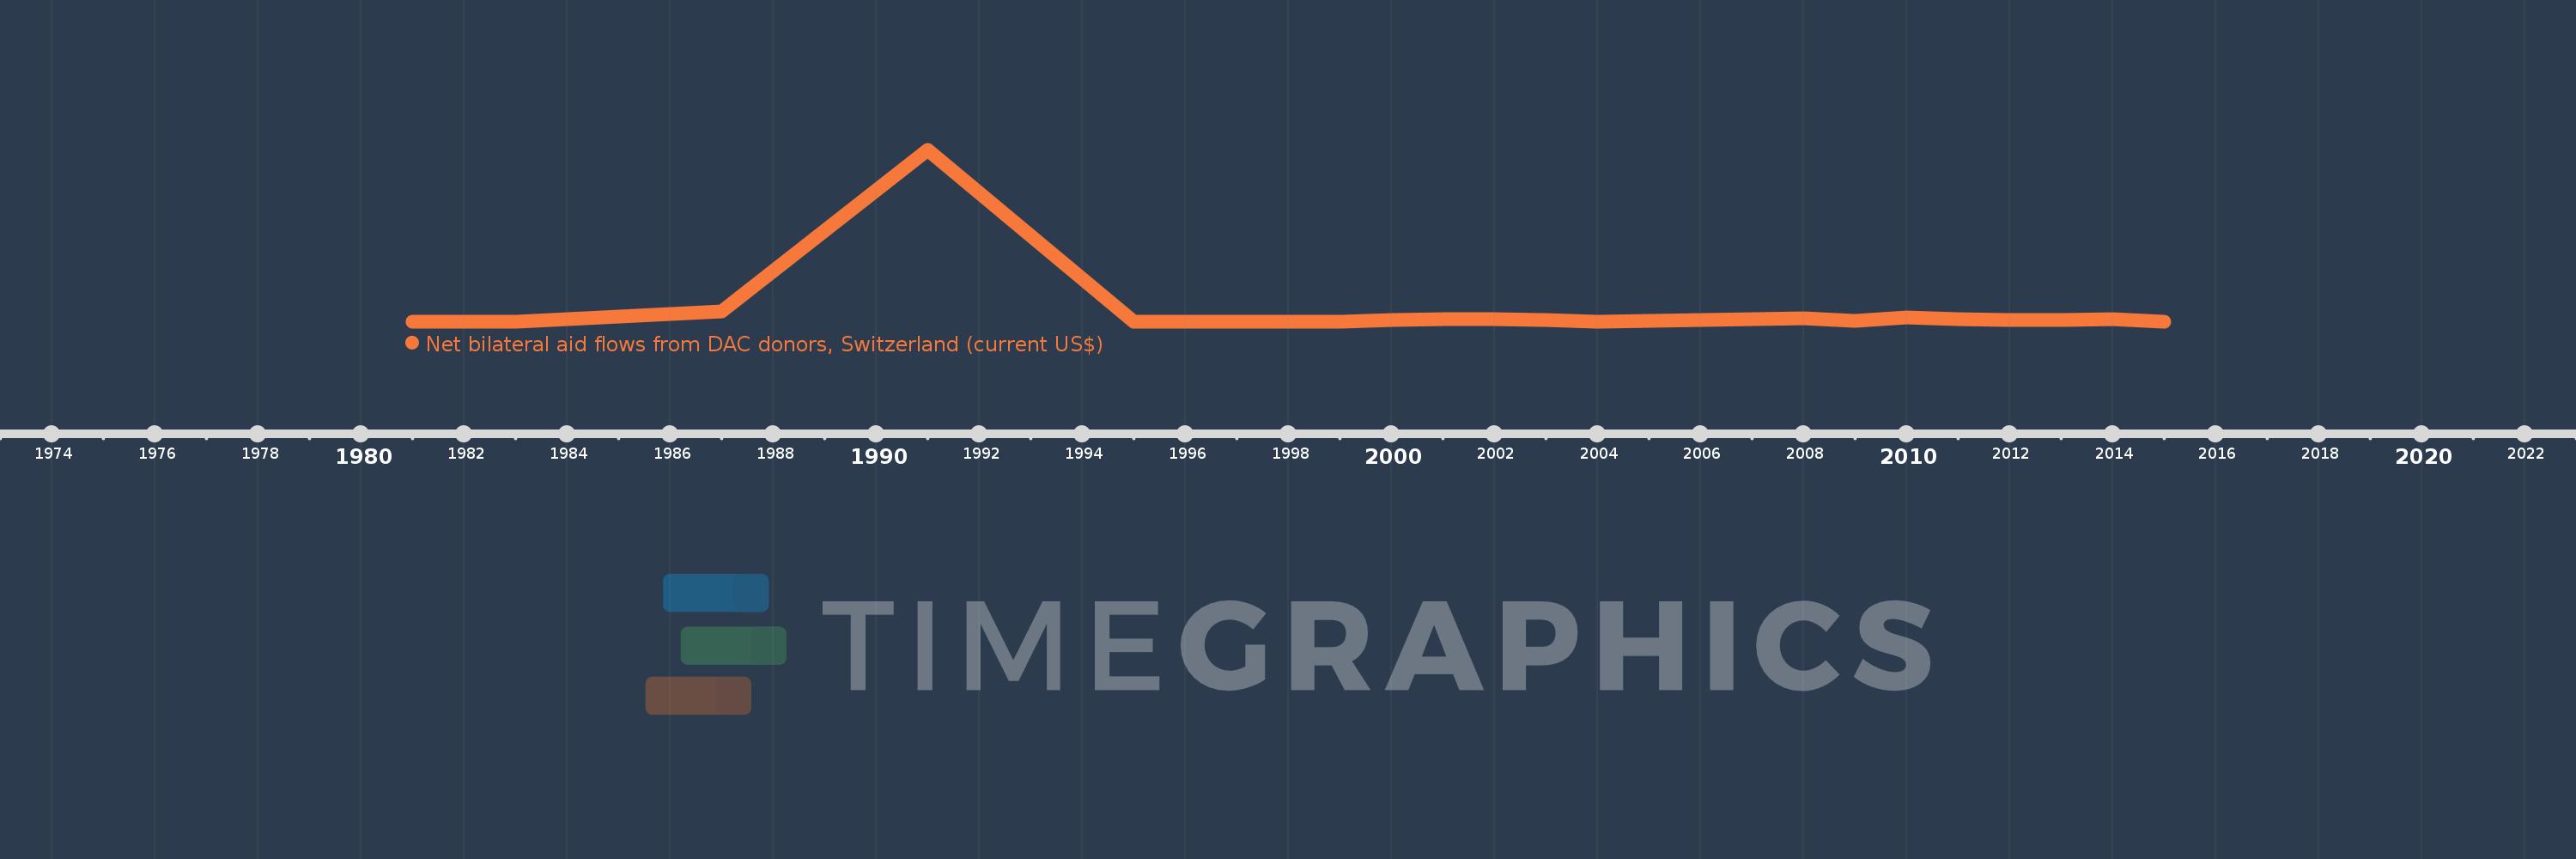
Net bilateral aid flows from DAC donors, Switzerland (current US$)
2015,2014,2013,2012,2011,2010,2009,2008,2004,2003,2002,2001,2000,1999,1998,1997,1995,1991,1987,1983,1981