29
/es/
es
AIzaSyAYiBZKx7MnpbEhh9jyipgxe19OcubqV5w
April 1, 2024
53427
Other small states
OSS
false
2
1
GNI, Atlas method (current US$)
2016,2015,2014,2013,2012,2011,2010,2009,2008,2007,2006,2005
Download
Estadísticas Globales de la Biblioteca →Other small states →

GNI, Atlas method (current US$)

Estas estadísticas en otros países:
AfghanistanAlbaniaAlgeriaAndorraAngolaAntigua and BarbudaArab WorldArgentinaArmeniaAustraliaAustriaAzerbaijanBahamas, TheBahrainBangladeshBarbadosBelarusBelgiumBelizeBeninBermudaBhutanBoliviaBosnia and HerzegovinaBotswanaBrazilBrunei DarussalamBulgariaBurkina FasoBurundiCabo VerdeCambodiaCameroonCanadaCaribbean small statesCentral African RepublicCentral Europe and the BalticsChadChannel IslandsChileChinaColombiaComorosCongo, Dem. Rep.Congo, Rep.Costa RicaCote d'IvoireCroatiaCubaCyprusCzech RepublicDenmarkDjiboutiDominicaDominican RepublicEarly-demographic dividendEast Asia & PacificEast Asia & Pacific (excluding high income)East Asia & Pacific (IDA & IBRD countries)EcuadorEgypt, Arab Rep.El SalvadorEquatorial GuineaEritreaEstoniaEthiopiaEuro areaEurope & Central AsiaEurope & Central Asia (excluding high income)Europe & Central Asia (IDA & IBRD countries)European UnionFijiFinlandFragile and conflict affected situationsFranceFrench PolynesiaGabonGambia, TheGeorgiaGermanyGhanaGreeceGreenlandGrenadaGuatemalaGuineaGuinea-BissauGuyanaHaitiHeavily indebted poor countries (HIPC)High incomeHondurasHong Kong SAR, ChinaHungaryIBRD onlyIcelandIDA & IBRD totalIDA blendIDA onlyIDA totalIndiaIndonesiaIran, Islamic Rep.IraqIrelandIsle of ManIsraelItalyJamaicaJapanJordanKazakhstanKenyaKiribatiKorea, Rep.KosovoKuwaitKyrgyz RepublicLao PDRLate-demographic dividendLatin America & Caribbean Latin America & Caribbean (excluding high income)Latin America & the Caribbean (IDA & IBRD countries)LatviaLeast developed countries: UN classificationLebanonLesothoLiberiaLibyaLiechtensteinLithuaniaLow & middle incomeLow incomeLower middle incomeLuxembourgMacao SAR, ChinaMacedonia, FYRMadagascarMalawiMalaysiaMaldivesMaliMaltaMarshall IslandsMauritaniaMauritiusMexicoMicronesia, Fed. Sts.Middle East & North AfricaMiddle East & North Africa (excluding high income)Middle East & North Africa (IDA & IBRD countries)Middle incomeMoldovaMonacoMongoliaMontenegroMoroccoMozambiqueMyanmarNamibiaNauruNepalNetherlandsNew CaledoniaNew ZealandNicaraguaNigerNigeriaNorth AmericaNorwayOECD membersOmanOther small statesPacific island small statesPakistanPalauPanamaPapua New GuineaParaguayPeruPhilippinesPolandPortugalPost-demographic dividendPre-demographic dividendPuerto RicoQatarRomaniaRussian FederationRwandaSamoaSan MarinoSao Tome and PrincipeSaudi ArabiaSenegalSerbiaSeychellesSierra LeoneSingaporeSlovak RepublicSloveniaSmall statesSolomon IslandsSouth AfricaSouth AsiaSouth Asia (IDA & IBRD)South SudanSpainSri LankaSt. Kitts and NevisSt. LuciaSt. Vincent and the GrenadinesSub-Saharan Africa Sub-Saharan Africa (excluding high income)Sub-Saharan Africa (IDA & IBRD countries)SudanSurinameSwazilandSwedenSwitzerlandSyrian Arab RepublicTajikistanTanzaniaThailandTimor-LesteTogoTongaTrinidad and TobagoTunisiaTurkeyTurkmenistanTuvaluUgandaUkraineUnited Arab EmiratesUnited KingdomUnited StatesUpper middle incomeUruguayUzbekistanVanuatuVenezuela, RBVietnamVirgin Islands (U.S.)West Bank and GazaWorldYemen, Rep.ZambiaZimbabwe
línea de tiempo (timeline):
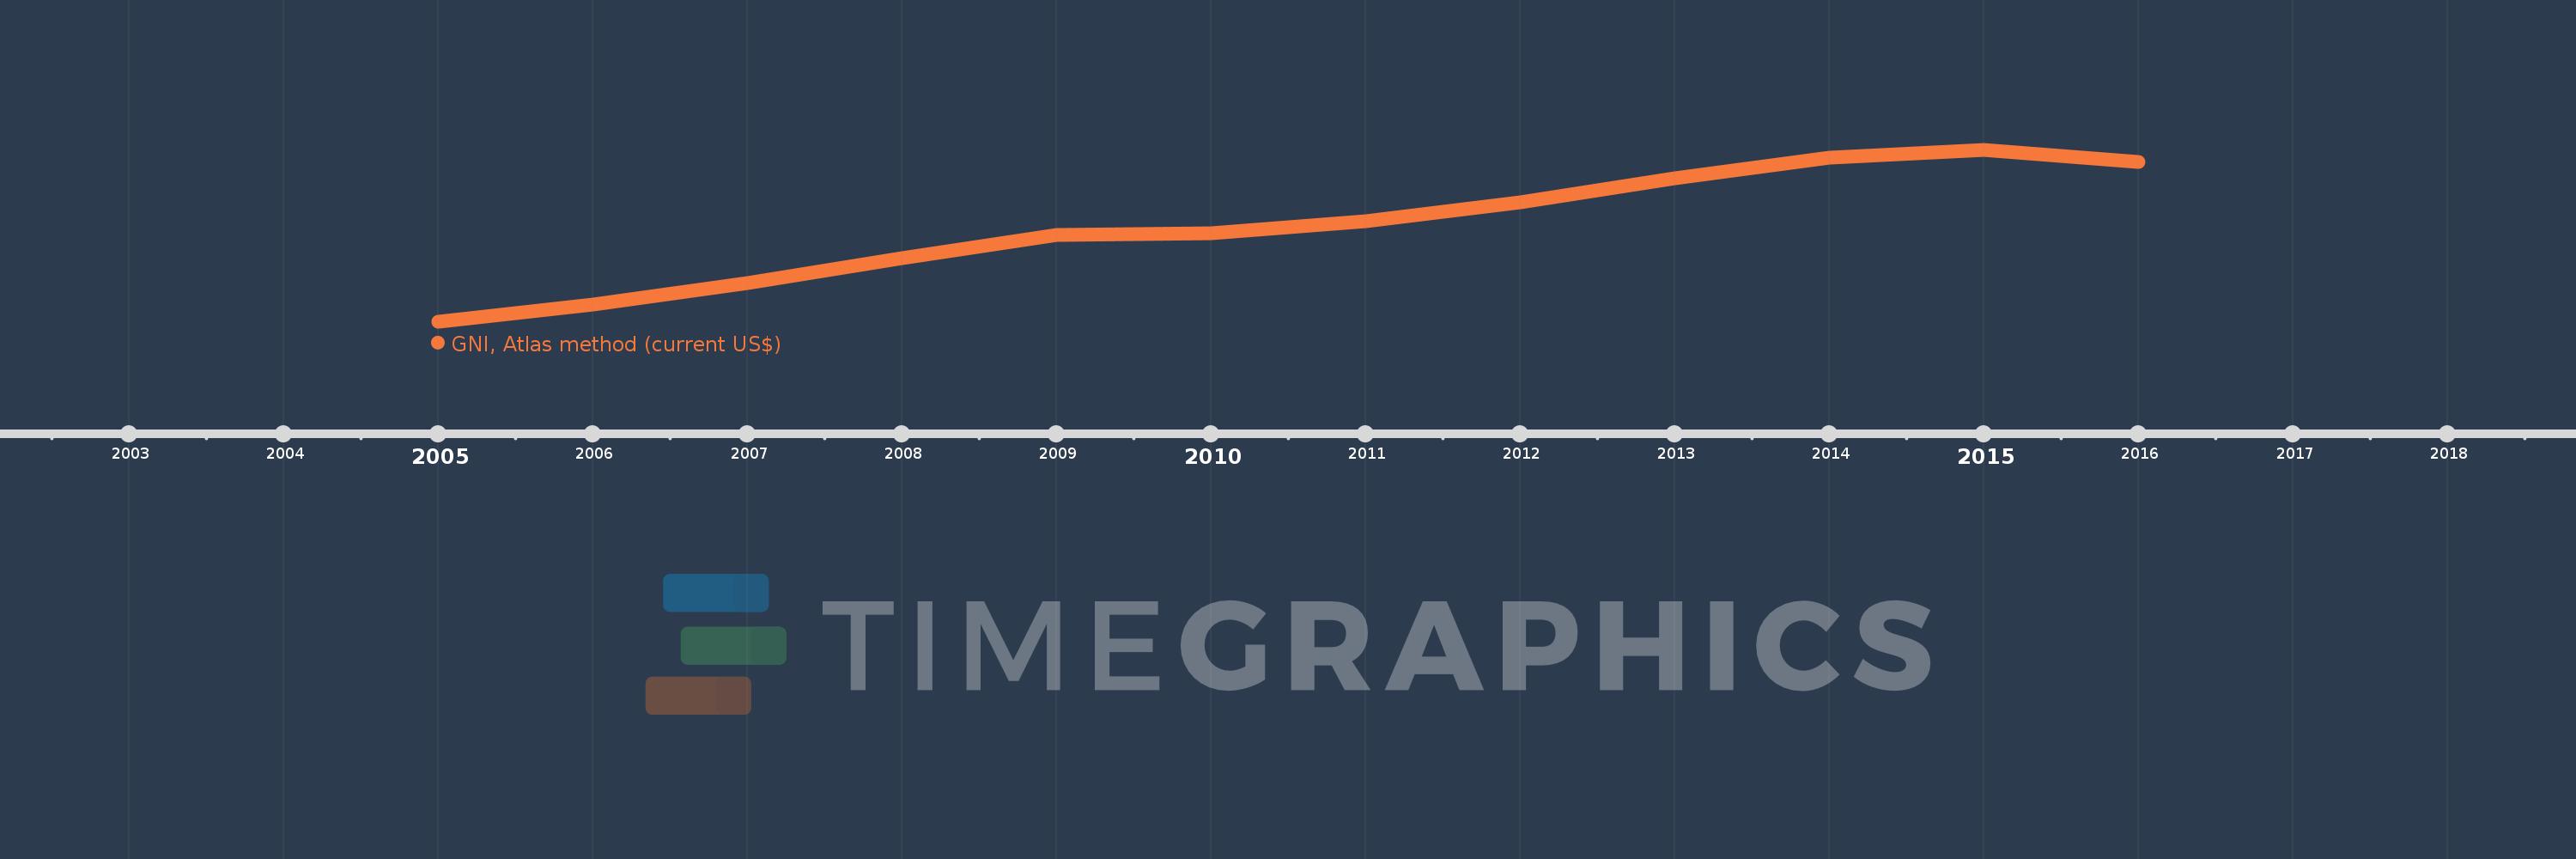
En esta escala de tiempo se presenta un gráfico de 2005 y 2016 de Other small states. Los datos de 2004 están ausentes. El número de observaciones reales por fecha: 12.
Fuente (nombre):
Indicadores del desarrollo mundial
Fuente (organización):
World Bank national accounts data, and OECD National Accounts data files.
Categorías:
Economy & Growth
Se ha actualizado:
23 abr 2017 año
Los indicadores de los cambios de valor en los últimos años
En promedio:
291.391 bn
Mínimo:
128.497 bn
1 ene 2005 año
Máximo:
419.098 bn
1 ene 2015 año
A la fecha de observación
Valor
Cambio absoluto
El cambio con respecto al valor anterior
1 ene 2005 año
128.497 bn
+128.497 bn
0.0%
1 ene 2006 año
157.378 bn
+28.881 bn
22.48%
1 ene 2007 año
194.815 bn
+37.437 bn
23.79%
1 ene 2008 año
236.081 bn
+41.266 bn
21.18%
1 ene 2009 año
275.487 bn
+39.406 bn
16.69%
1 ene 2010 año
278.553 bn
+3.067 bn
1.11%
1 ene 2011 año
298.245 bn
+19.692 bn
7.07%
1 ene 2012 año
330.83 bn
+32.585 bn
10.93%
1 ene 2013 año
371.852 bn
+41.022 bn
12.4%
1 ene 2014 año
407.019 bn
+35.166 bn
9.46%
1 ene 2015 año
419.098 bn
+12.08 bn
2.97%
1 ene 2016 año
398.831 bn
-20.267 bn
-4.84%
Ranking de los países por los datos estadísticos actuales

Comentarios:

Enviar
PremiumAbout & FeedbackAcuerdoPrivacidad
logo
© 2022 Selected Technologies LLC – Morgan Hill, California