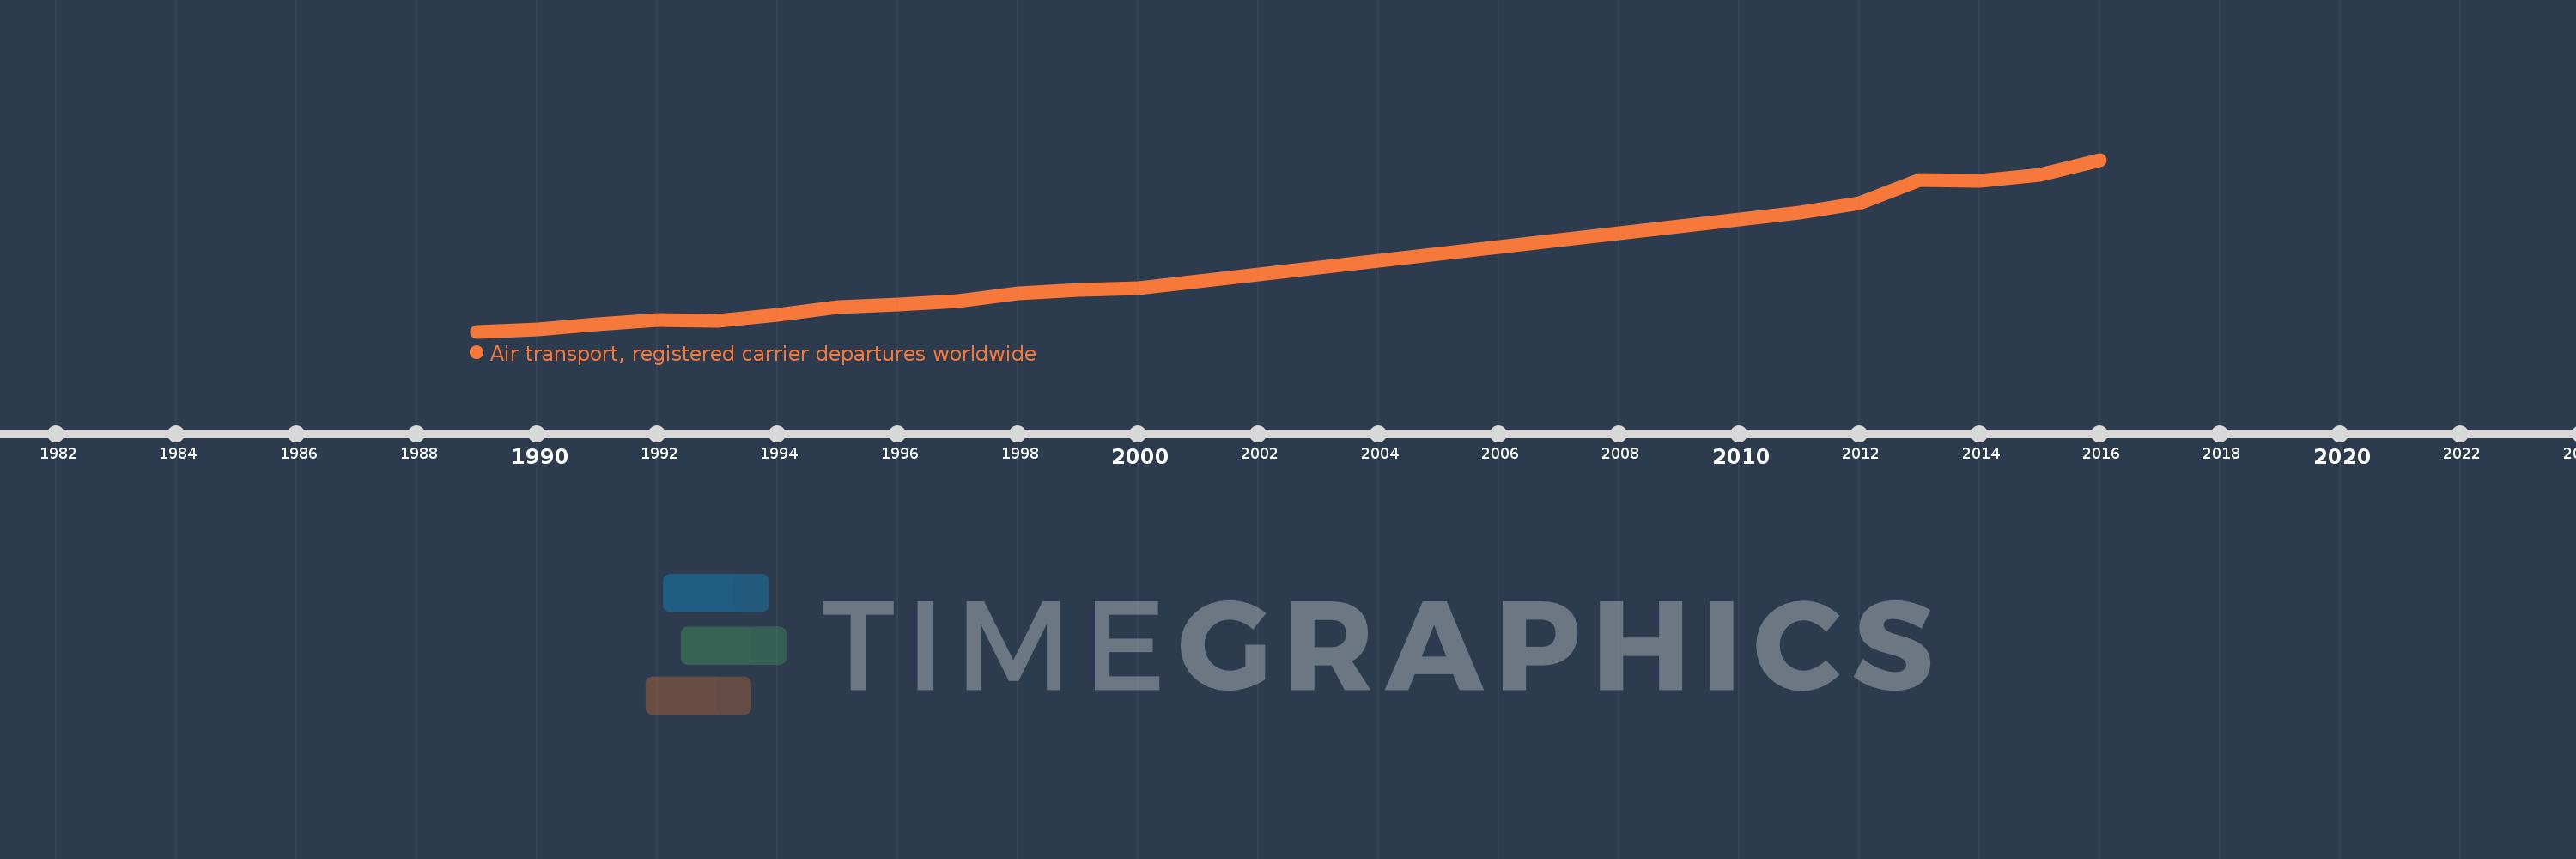
En esta escala de tiempo se presenta un gráfico de 1989 y 2016 de Other small states. Los datos de 1988 están ausentes. El número de observaciones reales por fecha: 18.
Fuente (nombre):
Indicadores del desarrollo mundial
Fuente (organización):
International Civil Aviation Organization, Civil Aviation Statistics of the World and ICAO staff estimates.
Categorías:
Infrastructure
Se ha actualizado:
23 abr 2017 año
Los indicadores de los cambios de valor en los últimos años
En promedio:
212.093 mil
Mínimo:
108.6 mil
1 ene 1989 año
Máximo:
391.226 mil
1 ene 2016 año
A la fecha de observación
Valor
Cambio absoluto
El cambio con respecto al valor anterior
1 ene 1989 año
108.6 mil
+108.6 mil
0.0%
1 ene 1990 año
111.9 mil
+3.3 mil
3.04%
1 ene 1991 año
120.4 mil
+8.5 mil
7.6%
1 ene 1992 año
128.3 mil
+7.9 mil
6.56%
1 ene 1993 año
126.6 mil
-1.7 mil
-1.33%
1 ene 1994 año
136.2 mil
+9.6 mil
7.58%
1 ene 1995 año
148.2 mil
+12.0 mil
8.81%
1 ene 1996 año
153.6 mil
+5.4 mil
3.64%
1 ene 1997 año
158.9 mil
+5.3 mil
3.45%
1 ene 1998 año
171.6 mil
+12.7 mil
7.99%
1 ene 1999 año
177.4 mil
+5.8 mil
3.38%
1 ene 2000 año
180.5 mil
+3.1 mil
1.75%
1 ene 2011 año
304.617 mil
+124.117 mil
68.76%
1 ene 2012 año
319.463 mil
+14.846 mil
4.87%
1 ene 2013 año
358.016 mil
+38.553 mil
12.07%
1 ene 2014 año
356.192 mil
-1.824 mil
-0.51%
1 ene 2015 año
365.966 mil
+9.774 mil
2.74%
1 ene 2016 año
391.226 mil
+25.26 mil
6.9%
Ranking de los países por los datos estadísticos actuales