33
/es/
AIzaSyAYiBZKx7MnpbEhh9jyipgxe19OcubqV5w
August 1, 2025
52675
OECD members
OED
false
2
1
Hospital beds (per 1,000 people)
2012,2011,2010,2009,2007,2006,2004,2003,2002,2001,2000,1999,1998,1997,1996,1995,1994,1993,1992,1991,1986,1981,1971,1961
Download
Estadísticas Globales de la Biblioteca →OECD members →

Hospital beds (per 1,000 people)

Estas estadísticas en otros países:

AfghanistanAlbaniaAlgeriaAndorraAngolaAntigua and BarbudaArab WorldArgentinaArmeniaAustraliaAustriaAzerbaijanBahamas, TheBahrainBangladeshBarbadosBelarusBelgiumBelizeBeninBermudaBhutanBoliviaBosnia and HerzegovinaBotswanaBrazilBrunei DarussalamBulgariaBurkina FasoBurundiCabo VerdeCambodiaCameroonCanadaCaribbean small statesCayman IslandsCentral African RepublicCentral Europe and the BalticsChadChannel IslandsChileChinaColombiaComorosCongo, Dem. Rep.Congo, Rep.Costa RicaCote d'IvoireCroatiaCubaCyprusCzech RepublicDenmarkDjiboutiDominicaDominican RepublicEarly-demographic dividendEast Asia & PacificEast Asia & Pacific (excluding high income)East Asia & Pacific (IDA & IBRD countries)EcuadorEgypt, Arab Rep.El SalvadorEquatorial GuineaEritreaEstoniaEthiopiaEuro areaEurope & Central AsiaEurope & Central Asia (excluding high income)Europe & Central Asia (IDA & IBRD countries)European UnionFijiFinlandFragile and conflict affected situationsFranceGabonGambia, TheGeorgiaGermanyGhanaGreeceGreenlandGrenadaGuatemalaGuineaGuinea-BissauGuyanaHaitiHeavily indebted poor countries (HIPC)High incomeHondurasHong Kong SAR, ChinaHungaryIBRD onlyIcelandIDA & IBRD totalIDA blendIDA onlyIDA totalIndiaIndonesiaIran, Islamic Rep.IraqIrelandIsraelItalyJamaicaJapanJordanKazakhstanKenyaKiribatiKorea, Dem. People’s Rep.Korea, Rep.KuwaitKyrgyz RepublicLao PDRLate-demographic dividendLatin America & Caribbean Latin America & Caribbean (excluding high income)Latin America & the Caribbean (IDA & IBRD countries)LatviaLeast developed countries: UN classificationLebanonLesothoLiberiaLibyaLithuaniaLow & middle incomeLow incomeLower middle incomeLuxembourgMacao SAR, ChinaMacedonia, FYRMadagascarMalawiMalaysiaMaldivesMaliMaltaMarshall IslandsMauritaniaMauritiusMexicoMicronesia, Fed. Sts.Middle East & North AfricaMiddle East & North Africa (excluding high income)Middle East & North Africa (IDA & IBRD countries)Middle incomeMoldovaMonacoMongoliaMontenegroMoroccoMozambiqueMyanmarNamibiaNauruNepalNetherlandsNew ZealandNicaraguaNigerNigeriaNorth AmericaNorwayOECD membersOmanPacific island small statesPakistanPalauPanamaPapua New GuineaParaguayPeruPhilippinesPolandPortugalPost-demographic dividendPre-demographic dividendPuerto RicoQatarRomaniaRussian FederationRwandaSamoaSan MarinoSao Tome and PrincipeSaudi ArabiaSenegalSerbiaSeychellesSierra LeoneSingaporeSlovak RepublicSloveniaSmall statesSolomon IslandsSomaliaSouth AfricaSouth AsiaSouth Asia (IDA & IBRD)SpainSri LankaSt. Kitts and NevisSt. LuciaSt. Vincent and the GrenadinesSub-Saharan Africa Sub-Saharan Africa (excluding high income)Sub-Saharan Africa (IDA & IBRD countries)SudanSurinameSwazilandSwedenSwitzerlandSyrian Arab RepublicTajikistanTanzaniaThailandTimor-LesteTogoTongaTrinidad and TobagoTunisiaTurkeyTurkmenistanTuvaluUgandaUkraineUnited Arab EmiratesUnited KingdomUnited StatesUpper middle incomeUruguayUzbekistanVanuatuVenezuela, RBVietnamVirgin Islands (U.S.)West Bank and GazaWorldYemen, Rep.ZambiaZimbabwe

línea de tiempo (timeline):

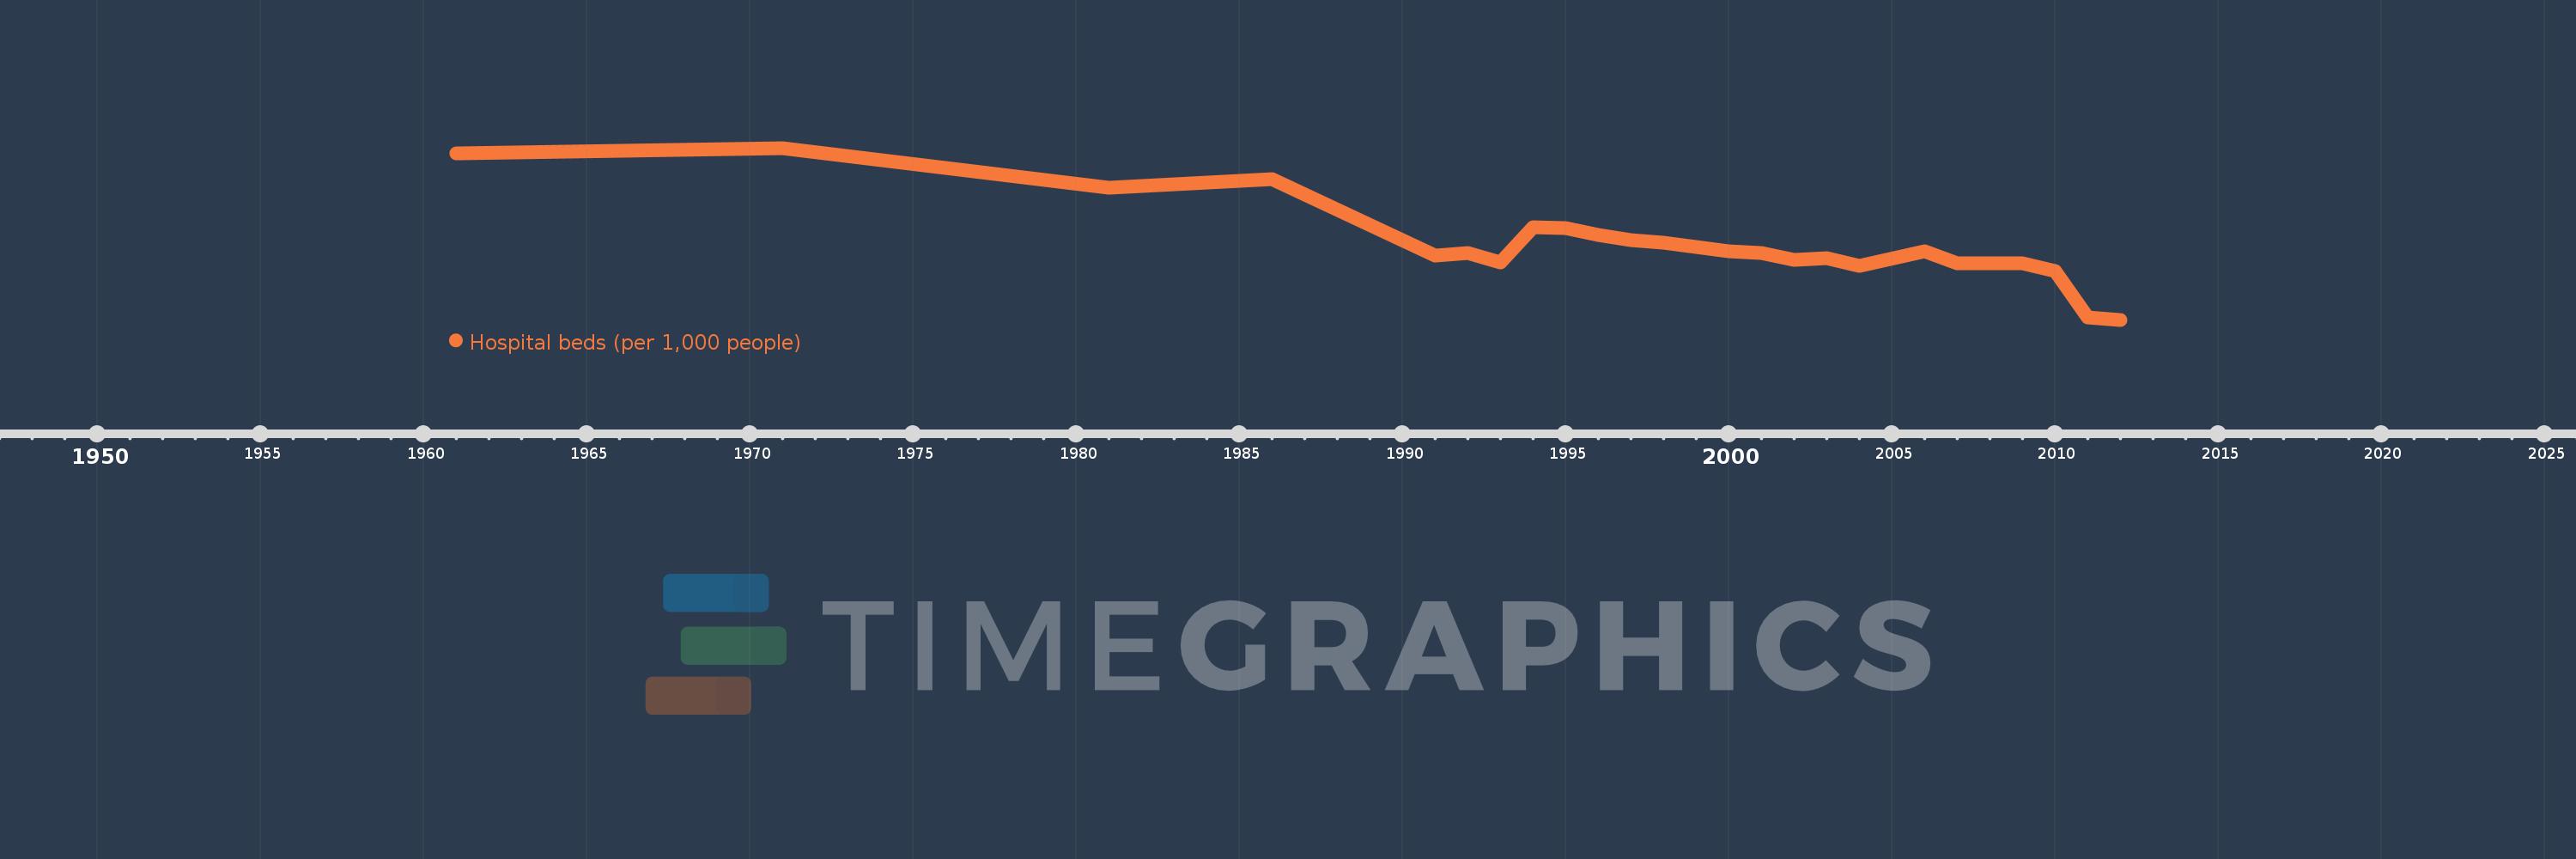
En esta escala de tiempo se presenta un gráfico de 1961 y 2012 de OECD members. Los datos de 1960 están ausentes. El número de observaciones reales por fecha: 24.

Fuente (nombre):

Indicadores del desarrollo mundial

Fuente (organización):

Data are from the World Health Organization, supplemented by country data.

Categorías:

Health

Se ha actualizado:

23 abr 2017 año

Los indicadores de los cambios de valor en los últimos años

En promedio:
6.059
Mínimo:
3.771
1 ene 2012 año
Máximo:
8.897
1 ene 1971 año
A la fecha de observación
Valor
Cambio absoluto
El cambio con respecto al valor anterior
1 ene 1961 año
8.747
+8.747
0.0%
1 ene 1971 año
8.897
+0.15
1.72%
1 ene 1981 año
7.709
-1.188
-13.35%
1 ene 1986 año
7.969
+0.259
3.36%
1 ene 1991 año
5.682
-2.287
-28.7%
1 ene 1992 año
5.757
+0.075
1.31%
1 ene 1993 año
5.487
-0.269
-4.68%
1 ene 1994 año
6.528
+1.041
18.97%
1 ene 1995 año
6.518
-0.01
-0.16%
1 ene 1996 año
6.299
-0.218
-3.35%
1 ene 1997 año
6.144
-0.156
-2.47%
1 ene 1998 año
6.061
-0.082
-1.34%
1 ene 1999 año
5.946
-0.115
-1.9%
1 ene 2000 año
5.821
-0.124
-2.09%
1 ene 2001 año
5.762
-0.06
-1.03%
1 ene 2002 año
5.562
-0.199
-3.46%
1 ene 2003 año
5.597
+0.035
0.62%
1 ene 2004 año
5.379
-0.218
-3.89%
1 ene 2006 año
5.812
+0.433
8.06%
1 ene 2007 año
5.443
-0.369
-6.35%
1 ene 2009 año
5.45
+0.007
0.12%
1 ene 2010 año
5.22
-0.23
-4.22%
1 ene 2011 año
3.848
-1.372
-26.29%
1 ene 2012 año
3.771
-0.076
-1.99%

Ranking de los países por los datos estadísticos actuales