29
/es/
es
AIzaSyAYiBZKx7MnpbEhh9jyipgxe19OcubqV5w
April 1, 2024
52130
North America
NAC
false
2
1
Other expense (% of expense)
2016,2015,2014,2013,2012,2011,2010,2009,2008,2007,2006,2005,2004,2003,2002,2001,2000,1999,1998,1997,1996,1995,1994,1993,1992,1991
Download
Estadísticas Globales de la Biblioteca →North America →

Other expense (% of expense)

Estas estadísticas en otros países:
AfghanistanAlbaniaAlgeriaAngolaArab WorldArmeniaAustraliaAustriaAzerbaijanBahrainBangladeshBarbadosBelarusBelgiumBelizeBeninBhutanBoliviaBosnia and HerzegovinaBotswanaBrazilBulgariaBurkina FasoBurundiCabo VerdeCambodiaCanadaCaribbean small statesCentral African RepublicCentral Europe and the BalticsChileColombiaCongo, Dem. Rep.Congo, Rep.Costa RicaCote d'IvoireCroatiaCyprusCzech RepublicDenmarkDominican RepublicEarly-demographic dividendEast Asia & PacificEast Asia & Pacific (excluding high income)East Asia & Pacific (IDA & IBRD countries)Egypt, Arab Rep.El SalvadorEquatorial GuineaEstoniaEthiopiaEuro areaEurope & Central AsiaEurope & Central Asia (excluding high income)Europe & Central Asia (IDA & IBRD countries)European UnionFijiFinlandFranceGambia, TheGeorgiaGermanyGhanaGreeceGrenadaGuatemalaHeavily indebted poor countries (HIPC)High incomeHondurasHong Kong SAR, ChinaHungaryIBRD onlyIcelandIDA & IBRD totalIDA onlyIDA totalIndiaIndonesiaIran, Islamic Rep.IraqIrelandIsraelItalyJamaicaJapanJordanKazakhstanKenyaKiribatiKorea, Rep.KuwaitKyrgyz RepublicLao PDRLate-demographic dividendLatin America & Caribbean Latin America & Caribbean (excluding high income)Latin America & the Caribbean (IDA & IBRD countries)LatviaLeast developed countries: UN classificationLebanonLesothoLithuaniaLow & middle incomeLow incomeLower middle incomeLuxembourgMacao SAR, ChinaMacedonia, FYRMadagascarMalawiMalaysiaMaldivesMaliMaltaMauritiusMicronesia, Fed. Sts.Middle East & North AfricaMiddle East & North Africa (excluding high income)Middle East & North Africa (IDA & IBRD countries)Middle incomeMoldovaMongoliaMoroccoMozambiqueNamibiaNepalNetherlandsNew ZealandNicaraguaNorth AmericaNorwayOECD membersOmanOther small statesPakistanPanamaPapua New GuineaParaguayPeruPhilippinesPolandPortugalPost-demographic dividendPre-demographic dividendQatarRomaniaRussian FederationRwandaSamoaSan MarinoSao Tome and PrincipeSerbiaSeychellesSierra LeoneSlovak RepublicSloveniaSmall statesSolomon IslandsSouth AfricaSouth AsiaSouth Asia (IDA & IBRD)SpainSri LankaSub-Saharan Africa Sub-Saharan Africa (excluding high income)Sub-Saharan Africa (IDA & IBRD countries)SurinameSwazilandSwedenSwitzerlandTajikistanTanzaniaThailandTimor-LesteTogoTrinidad and TobagoTunisiaTurkeyUgandaUkraineUnited Arab EmiratesUnited KingdomUnited StatesUpper middle incomeUruguayVanuatuVenezuela, RBWest Bank and GazaWorldYemen, Rep.Zambia
línea de tiempo (timeline):
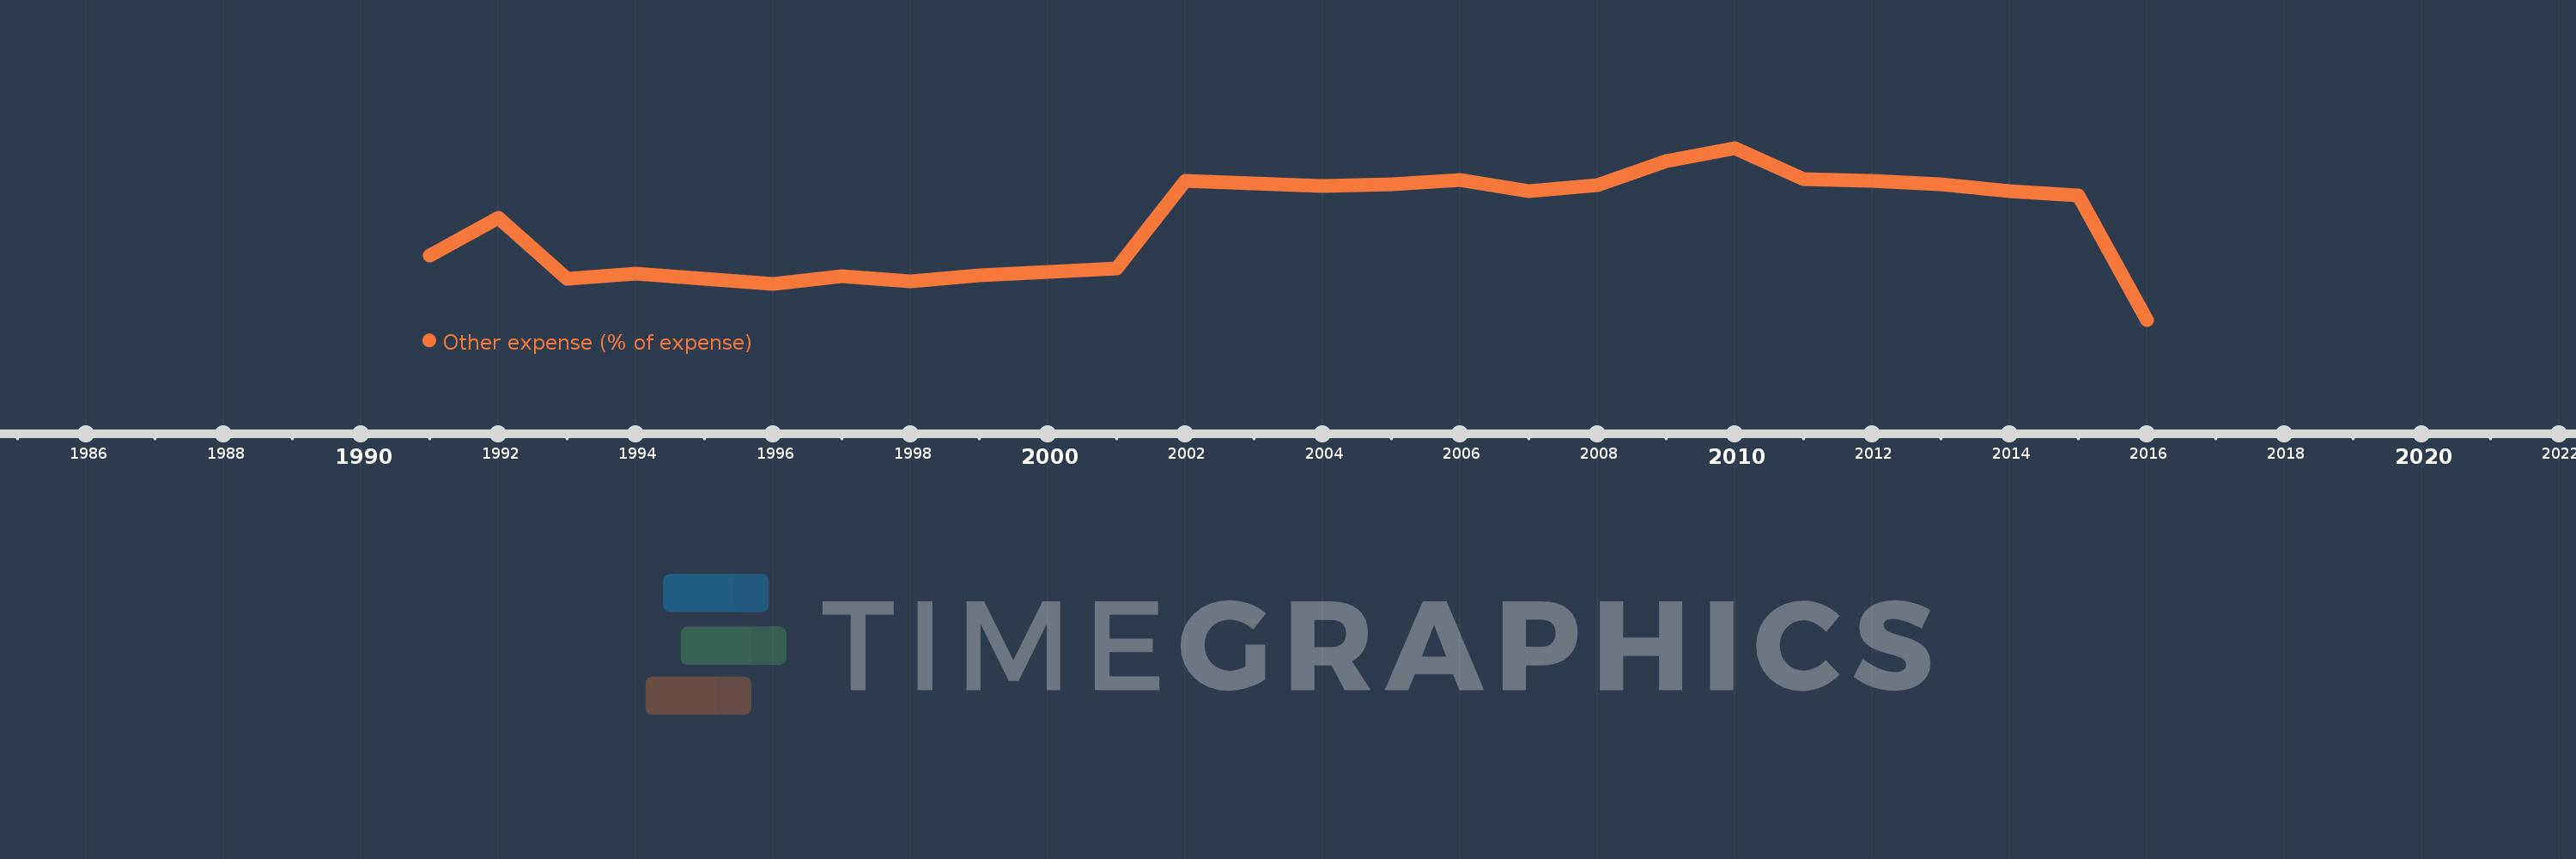
En esta escala de tiempo se presenta un gráfico de 1991 y 2016 de North America. Los datos de 1990 están ausentes. El número de observaciones reales por fecha: 26.
Fuente (nombre):
Indicadores del desarrollo mundial
Fuente (organización):
International Monetary Fund, Government Finance Statistics Yearbook and data files.
Categorías:
Public Sector
Se ha actualizado:
23 abr 2017 año
Los indicadores de los cambios de valor en los últimos años
En promedio:
4.757
Mínimo:
1.013
1 ene 2016 año
Máximo:
7.698
1 ene 2010 año
A la fecha de observación
Valor
Cambio absoluto
El cambio con respecto al valor anterior
1 ene 1991 año
3.496
+3.496
0.0%
1 ene 1992 año
4.964
+1.468
42.0%
1 ene 1993 año
2.624
-2.339
-47.13%
1 ene 1994 año
2.802
+0.178
6.77%
1 ene 1995 año
2.607
-0.195
-6.96%
1 ene 1996 año
2.417
-0.19
-7.29%
1 ene 1997 año
2.699
+0.282
11.68%
1 ene 1998 año
2.499
-0.201
-7.43%
1 ene 1999 año
2.745
+0.246
9.85%
1 ene 2000 año
2.883
+0.138
5.04%
1 ene 2001 año
2.993
+0.11
3.81%
1 ene 2002 año
6.421
+3.428
114.55%
1 ene 2003 año
6.326
-0.095
-1.48%
1 ene 2004 año
6.233
-0.093
-1.46%
1 ene 2005 año
6.294
+0.061
0.98%
1 ene 2006 año
6.435
+0.14
2.23%
1 ene 2007 año
6.029
-0.406
-6.31%
1 ene 2008 año
6.263
+0.234
3.89%
1 ene 2009 año
7.198
+0.935
14.93%
1 ene 2010 año
7.698
+0.499
6.93%
1 ene 2011 año
6.476
-1.221
-15.87%
1 ene 2012 año
6.411
-0.065
-1.01%
1 ene 2013 año
6.293
-0.118
-1.83%
1 ene 2014 año
6.001
-0.292
-4.64%
1 ene 2015 año
5.862
-0.138
-2.31%
1 ene 2016 año
1.013
-4.849
-82.72%
Ranking de los países por los datos estadísticos actuales

Comentarios:

Enviar
PremiumAbout & FeedbackAcuerdoPrivacidad
logo
© 2022 Selected Technologies LLC – Morgan Hill, California