33
/es/
AIzaSyAYiBZKx7MnpbEhh9jyipgxe19OcubqV5w
August 1, 2025
51912
North America
NAC
false
2
1
Health expenditure, public (% of government expenditure)
2015,2014,2013,2012,2011,2010,2009,2008,2007,2006,2005,2004,2003,2002,2001,2000,1999,1998,1997,1996
Download
Estadísticas Globales de la Biblioteca →North America →

Health expenditure, public (% of government expenditure)

Estas estadísticas en otros países:

AfghanistanAlbaniaAlgeriaAndorraAngolaAntigua and BarbudaArgentinaArmeniaAustraliaAustriaAzerbaijanBahamas, TheBahrainBangladeshBarbadosBelarusBelgiumBelizeBeninBhutanBoliviaBosnia and HerzegovinaBotswanaBrazilBrunei DarussalamBulgariaBurkina FasoBurundiCabo VerdeCambodiaCameroonCanadaCaribbean small statesCentral African RepublicCentral Europe and the BalticsChadChileChinaColombiaComorosCongo, Dem. Rep.Congo, Rep.Costa RicaCote d'IvoireCroatiaCubaCyprusCzech RepublicDenmarkDjiboutiDominicaDominican RepublicEarly-demographic dividendEcuadorEgypt, Arab Rep.El SalvadorEquatorial GuineaEritreaEstoniaEthiopiaEuro areaEurope & Central AsiaEurope & Central Asia (excluding high income)Europe & Central Asia (IDA & IBRD countries)European UnionFijiFinlandFranceGabonGambia, TheGeorgiaGermanyGhanaGreeceGrenadaGuatemalaGuineaGuinea-BissauGuyanaHaitiHeavily indebted poor countries (HIPC)High incomeHondurasHungaryIcelandIDA blendIDA onlyIDA totalIndiaIndonesiaIran, Islamic Rep.IraqIrelandIsraelItalyJamaicaJapanJordanKazakhstanKenyaKiribatiKorea, Rep.KuwaitKyrgyz RepublicLao PDRLatin America & Caribbean Latin America & Caribbean (excluding high income)Latin America & the Caribbean (IDA & IBRD countries)LatviaLeast developed countries: UN classificationLebanonLesothoLiberiaLibyaLithuaniaLow incomeLower middle incomeLuxembourgMacedonia, FYRMadagascarMalawiMalaysiaMaldivesMaliMaltaMarshall IslandsMauritaniaMauritiusMexicoMicronesia, Fed. Sts.Middle East & North AfricaMiddle East & North Africa (excluding high income)Middle East & North Africa (IDA & IBRD countries)MoldovaMonacoMongoliaMontenegroMoroccoMozambiqueMyanmarNamibiaNauruNepalNetherlandsNew ZealandNicaraguaNigerNigeriaNorth AmericaNorwayOECD membersOmanOther small statesPacific island small statesPakistanPalauPanamaPapua New GuineaParaguayPeruPhilippinesPolandPortugalPost-demographic dividendPre-demographic dividendQatarRomaniaRussian FederationRwandaSamoaSan MarinoSao Tome and PrincipeSaudi ArabiaSenegalSerbiaSeychellesSierra LeoneSingaporeSlovak RepublicSloveniaSmall statesSolomon IslandsSouth AfricaSouth AsiaSouth Asia (IDA & IBRD)South SudanSpainSri LankaSt. Kitts and NevisSt. LuciaSt. Vincent and the GrenadinesSub-Saharan Africa Sub-Saharan Africa (excluding high income)Sub-Saharan Africa (IDA & IBRD countries)SudanSurinameSwazilandSwedenSwitzerlandSyrian Arab RepublicTajikistanTanzaniaThailandTimor-LesteTogoTongaTrinidad and TobagoTunisiaTurkeyTurkmenistanTuvaluUgandaUkraineUnited Arab EmiratesUnited KingdomUnited StatesUruguayUzbekistanVanuatuVenezuela, RBVietnamWorldYemen, Rep.ZambiaZimbabwe

línea de tiempo (timeline):

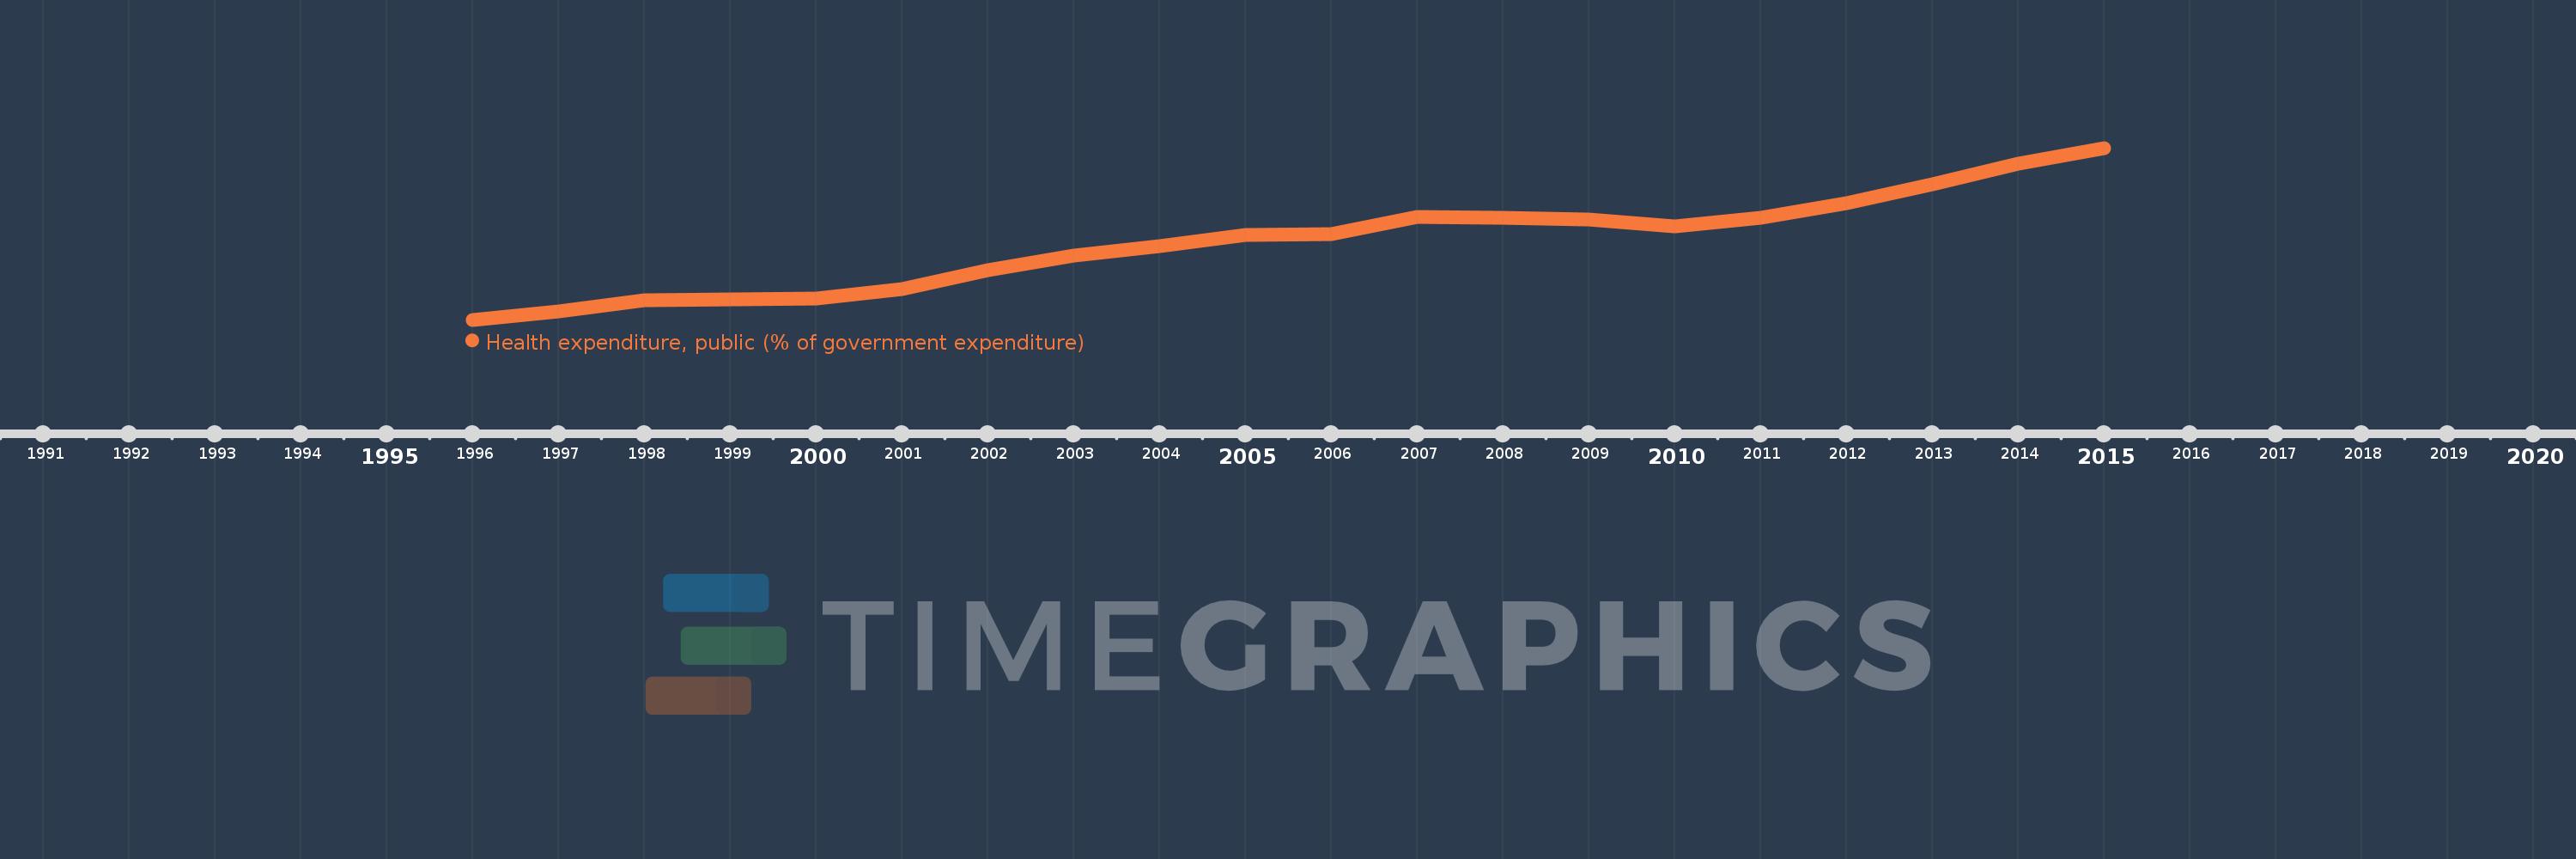
En esta escala de tiempo se presenta un gráfico de 1996 y 2015 de North America. Los datos de 1995 están ausentes. El número de observaciones reales por fecha: 20.

Fuente (nombre):

Indicadores del desarrollo mundial

Fuente (organización):

World Health Organization Global Health Expenditure database (see http://apps.who.int/nha/database for the most recent updates).

Categorías:

Health

Se ha actualizado:

23 abr 2017 año

Los indicadores de los cambios de valor en los últimos años

En promedio:
18.122
Mínimo:
15.697
1 ene 1996 año
Máximo:
21.118
1 ene 2015 año
A la fecha de observación
Valor
Cambio absoluto
El cambio con respecto al valor anterior
1 ene 1996 año
15.697
+15.697
0.0%
1 ene 1997 año
15.948
+0.251
1.6%
1 ene 1998 año
16.318
+0.37
2.32%
1 ene 1999 año
16.334
+0.016
0.1%
1 ene 2000 año
16.371
+0.037
0.23%
1 ene 2001 año
16.668
+0.297
1.81%
1 ene 2002 año
17.26
+0.592
3.55%
1 ene 2003 año
17.735
+0.474
2.75%
1 ene 2004 año
18.009
+0.274
1.54%
1 ene 2005 año
18.367
+0.359
1.99%
1 ene 2006 año
18.397
+0.03
0.16%
1 ene 2007 año
18.935
+0.537
2.92%
1 ene 2008 año
18.924
-0.01
-0.05%
1 ene 2009 año
18.85
-0.075
-0.39%
1 ene 2010 año
18.643
-0.206
-1.09%
1 ene 2011 año
18.916
+0.272
1.46%
1 ene 2012 año
19.383
+0.467
2.47%
1 ene 2013 año
19.963
+0.58
2.99%
1 ene 2014 año
20.613
+0.651
3.26%
1 ene 2015 año
21.118
+0.504
2.45%

Ranking de los países por los datos estadísticos actuales