33
/es/
AIzaSyB4mHJ5NPEv-XzF7P6NDYXjlkCWaeKw5bc
November 30, 2025
47897
Middle East & North Africa
MEA
false
2
1
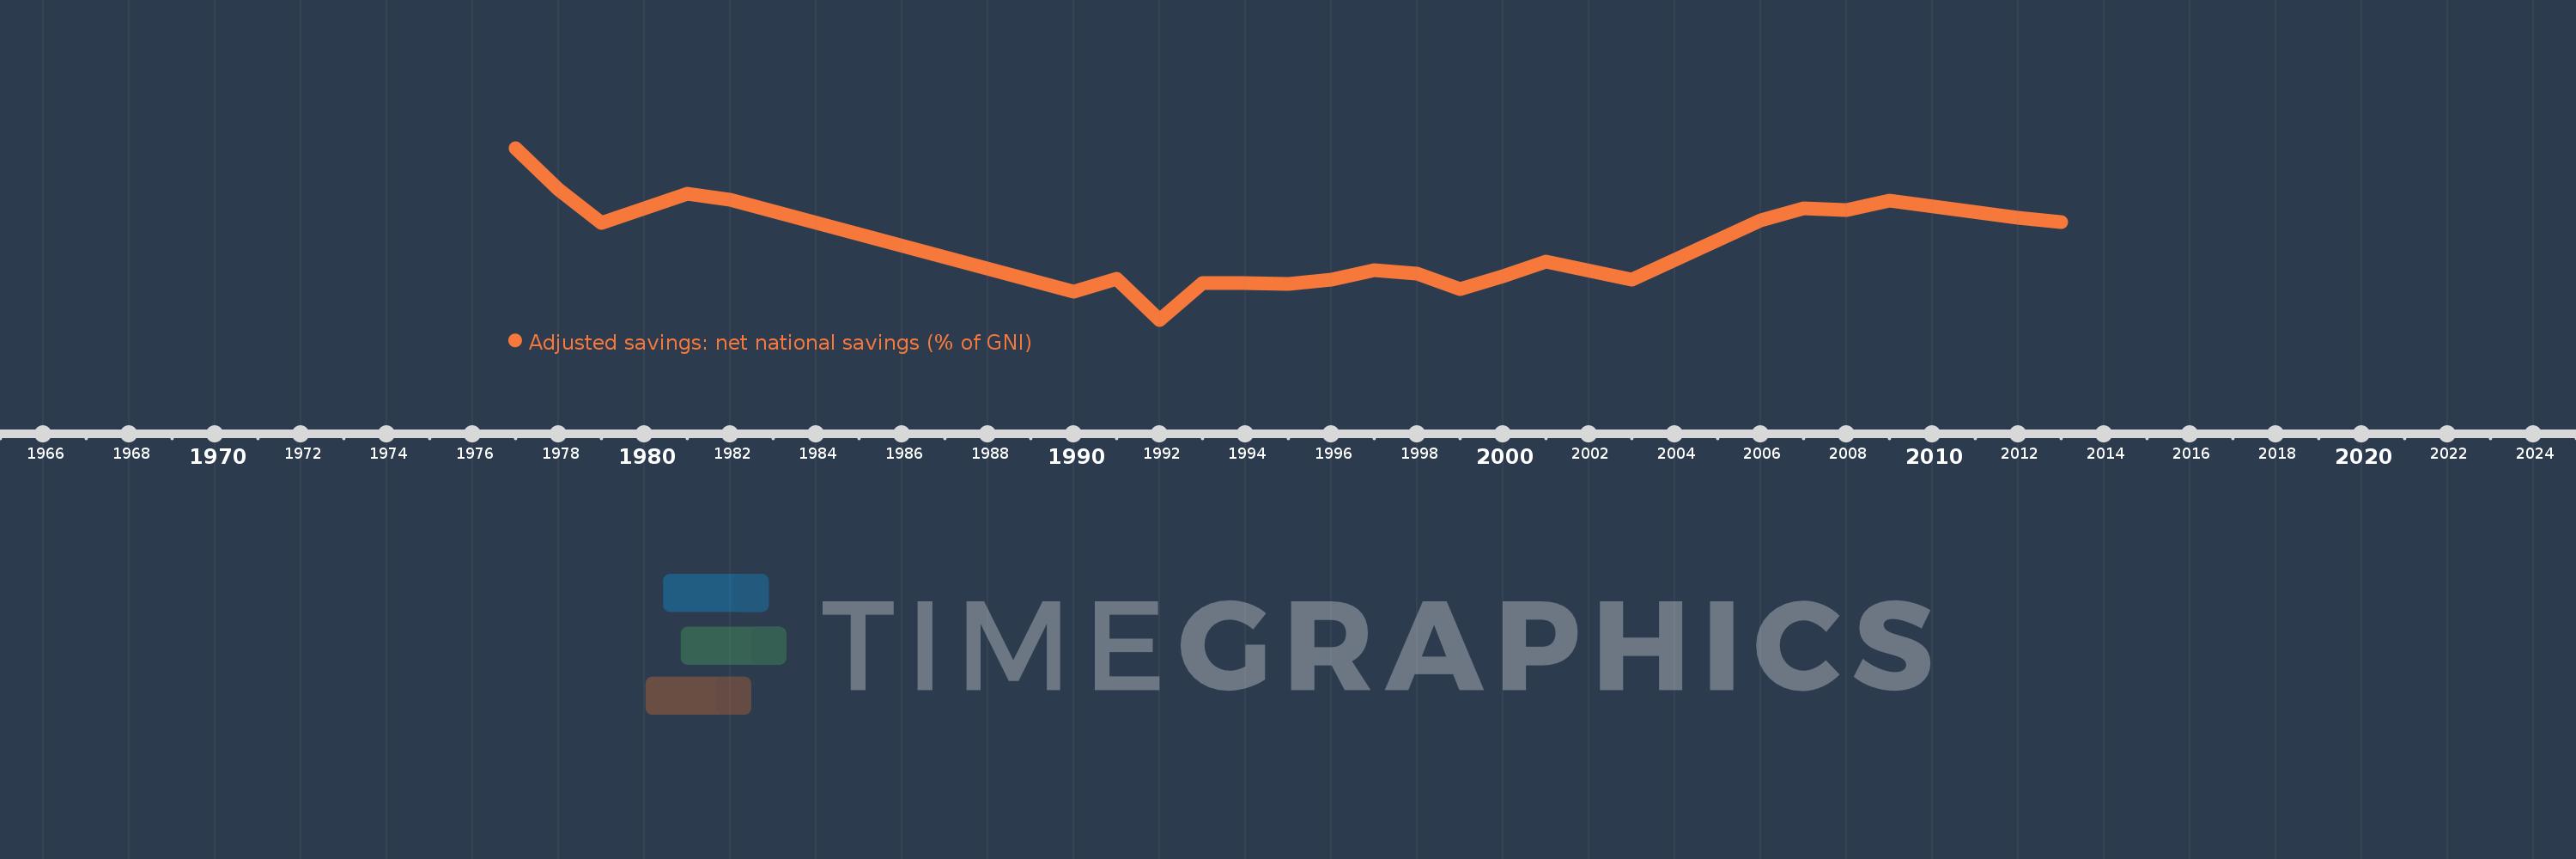
Adjusted savings: net national savings (% of GNI)
2013,2012,2009,2008,2007,2006,2003,2001,2000,1999,1998,1997,1996,1995,1994,1993,1992,1991,1990,1982,1981,1980,1979,1978,1977