33
/es/
AIzaSyB4mHJ5NPEv-XzF7P6NDYXjlkCWaeKw5bc
November 1, 2025
43628
Latin America & the Caribbean (IDA & IBRD countries)
TLA
false
2
1
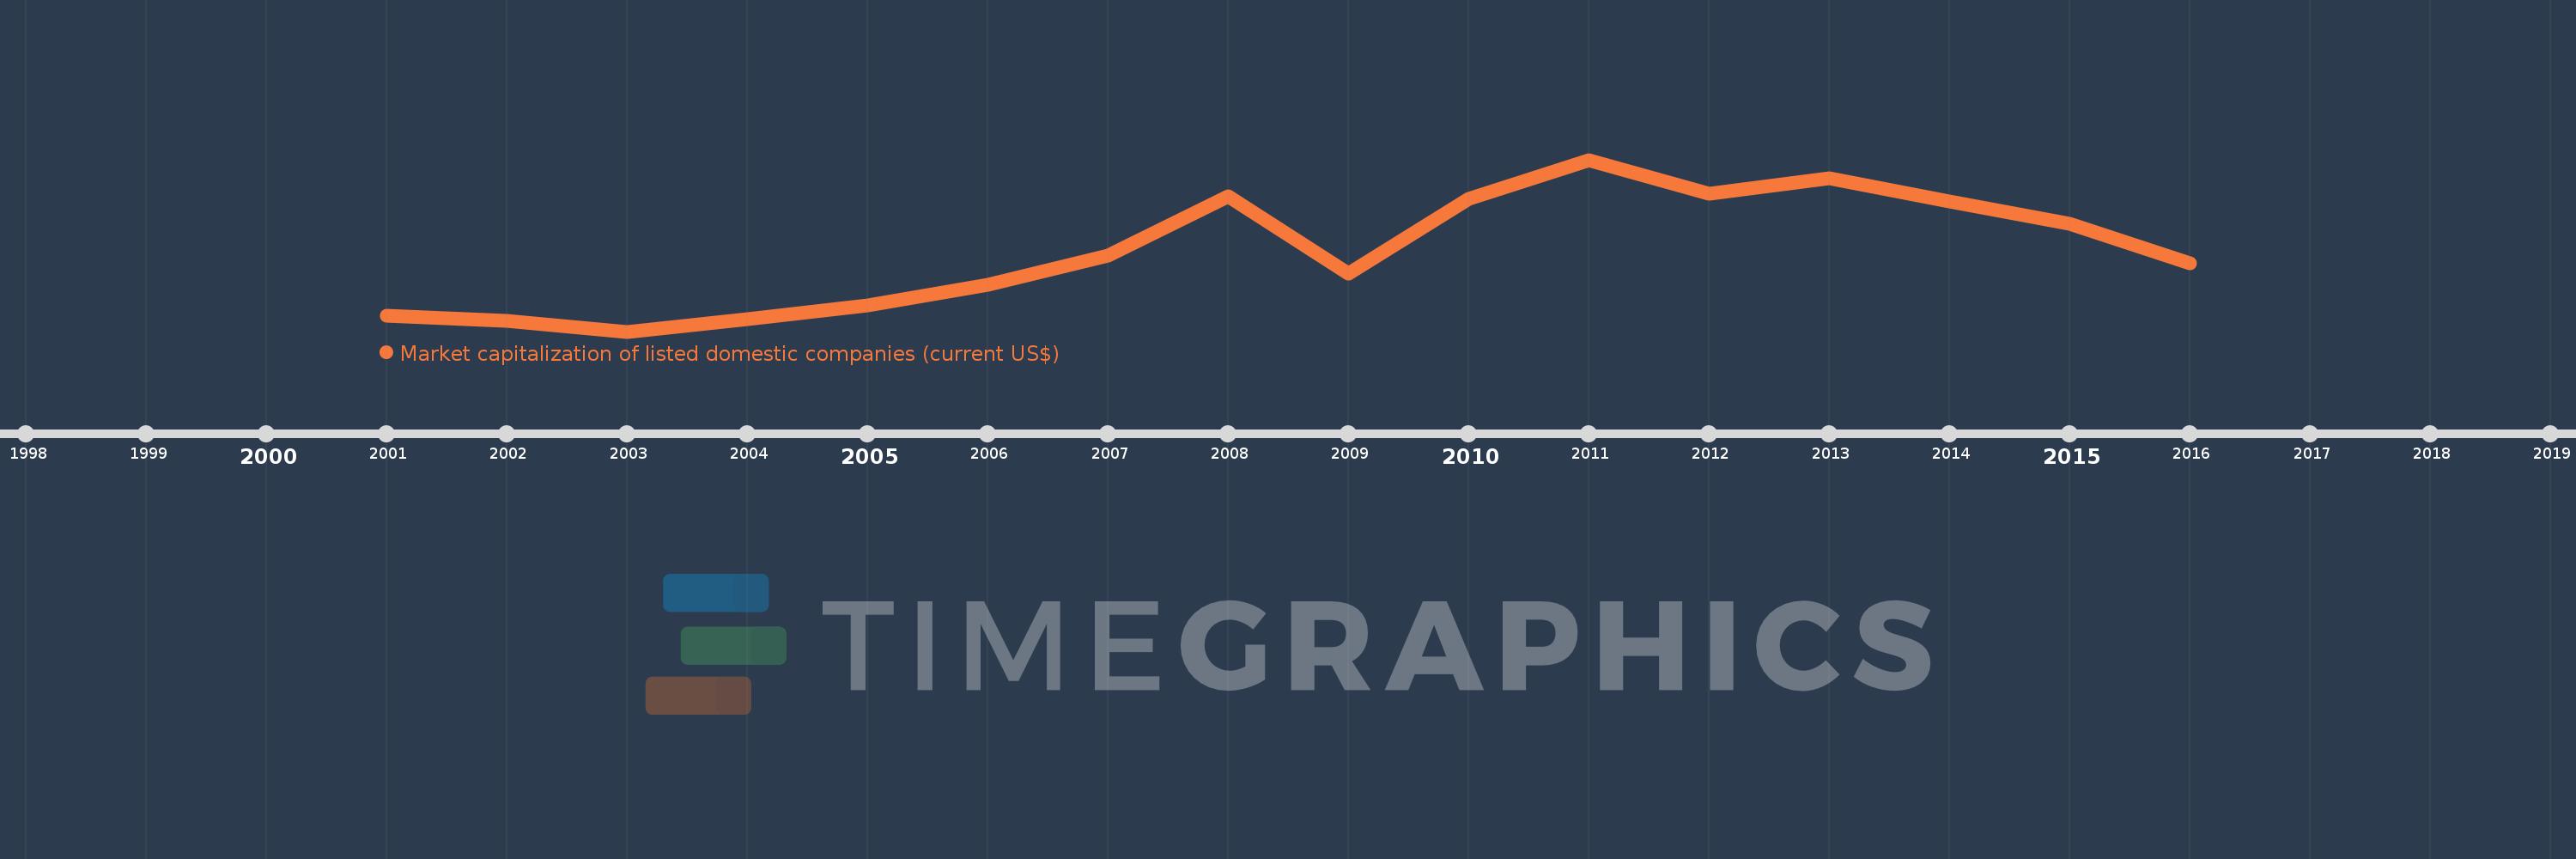
Market capitalization of listed domestic companies (current US$)
2016,2015,2014,2013,2012,2011,2010,2009,2008,2007,2006,2005,2004,2003,2002,2001