33
/es/
AIzaSyAYiBZKx7MnpbEhh9jyipgxe19OcubqV5w
August 1, 2025
42320
Latin America & Caribbean (excluding high income)
LAC
false
2
1
Expenditure on education as % of total government expenditure (%)
2013,2012,2011,2010,2009,2008,2007,2004,2003,2002,2001,2000
Download
Estadísticas Globales de la Biblioteca →Latin America & Caribbean (excluding high income) →

Expenditure on education as % of total government expenditure (%)

Estas estadísticas en otros países:

AfghanistanAlbaniaAlgeriaAngolaAntigua and BarbudaArab WorldArgentinaArmeniaArubaAustraliaAustriaAzerbaijanBahamas, TheBahrainBangladeshBarbadosBelarusBelgiumBelizeBeninBermudaBhutanBoliviaBotswanaBrazilBrunei DarussalamBulgariaBurkina FasoBurundiCabo VerdeCambodiaCameroonCanadaCaribbean small statesCentral African RepublicCentral Europe and the BalticsChadChileChinaColombiaComorosCongo, Dem. Rep.Congo, Rep.Costa RicaCote d'IvoireCroatiaCyprusCzech RepublicDenmarkDjiboutiDominicaDominican RepublicEarly-demographic dividendEast Asia & PacificEast Asia & Pacific (excluding high income)East Asia & Pacific (IDA & IBRD countries)EcuadorEgypt, Arab Rep.El SalvadorEquatorial GuineaEritreaEstoniaEthiopiaEuro areaEurope & Central AsiaEurope & Central Asia (excluding high income)Europe & Central Asia (IDA & IBRD countries)European UnionFijiFinlandFranceGabonGambia, TheGeorgiaGermanyGhanaGreeceGrenadaGuatemalaGuineaGuinea-BissauGuyanaHeavily indebted poor countries (HIPC)High incomeHondurasHong Kong SAR, ChinaHungaryIBRD onlyIcelandIDA & IBRD totalIDA blendIDA onlyIDA totalIndiaIndonesiaIran, Islamic Rep.IrelandIsraelItalyJamaicaJapanJordanKazakhstanKenyaKiribatiKuwaitKyrgyz RepublicLao PDRLate-demographic dividendLatin America & Caribbean Latin America & Caribbean (excluding high income)Latin America & the Caribbean (IDA & IBRD countries)LatviaLeast developed countries: UN classificationLebanonLesothoLiberiaLibyaLithuaniaLow & middle incomeLow incomeLower middle incomeLuxembourgMacao SAR, ChinaMacedonia, FYRMadagascarMalawiMalaysiaMaldivesMaliMaltaMarshall IslandsMauritaniaMauritiusMexicoMicronesia, Fed. Sts.Middle East & North AfricaMiddle East & North Africa (excluding high income)Middle East & North Africa (IDA & IBRD countries)Middle incomeMoldovaMonacoMongoliaMoroccoMozambiqueNamibiaNepalNetherlandsNew ZealandNicaraguaNigerNorth AmericaNorwayOECD membersOmanOther small statesPakistanPalauPanamaParaguayPeruPhilippinesPolandPortugalPost-demographic dividendPre-demographic dividendPuerto RicoQatarRomaniaRussian FederationRwandaSamoaSan MarinoSao Tome and PrincipeSaudi ArabiaSenegalSerbiaSeychellesSierra LeoneSingaporeSlovak RepublicSloveniaSmall statesSolomon IslandsSouth AfricaSouth AsiaSouth Asia (IDA & IBRD)South SudanSpainSri LankaSt. Kitts and NevisSt. LuciaSt. Vincent and the GrenadinesSub-Saharan Africa Sub-Saharan Africa (excluding high income)Sub-Saharan Africa (IDA & IBRD countries)SudanSwazilandSwedenSwitzerlandSyrian Arab RepublicTajikistanTanzaniaThailandTimor-LesteTogoTongaTrinidad and TobagoTunisiaTurkeyTurkmenistanUgandaUkraineUnited Arab EmiratesUnited KingdomUnited StatesUpper middle incomeUruguayVanuatuVenezuela, RBVietnamWorldYemen, Rep.ZambiaZimbabwe

línea de tiempo (timeline):

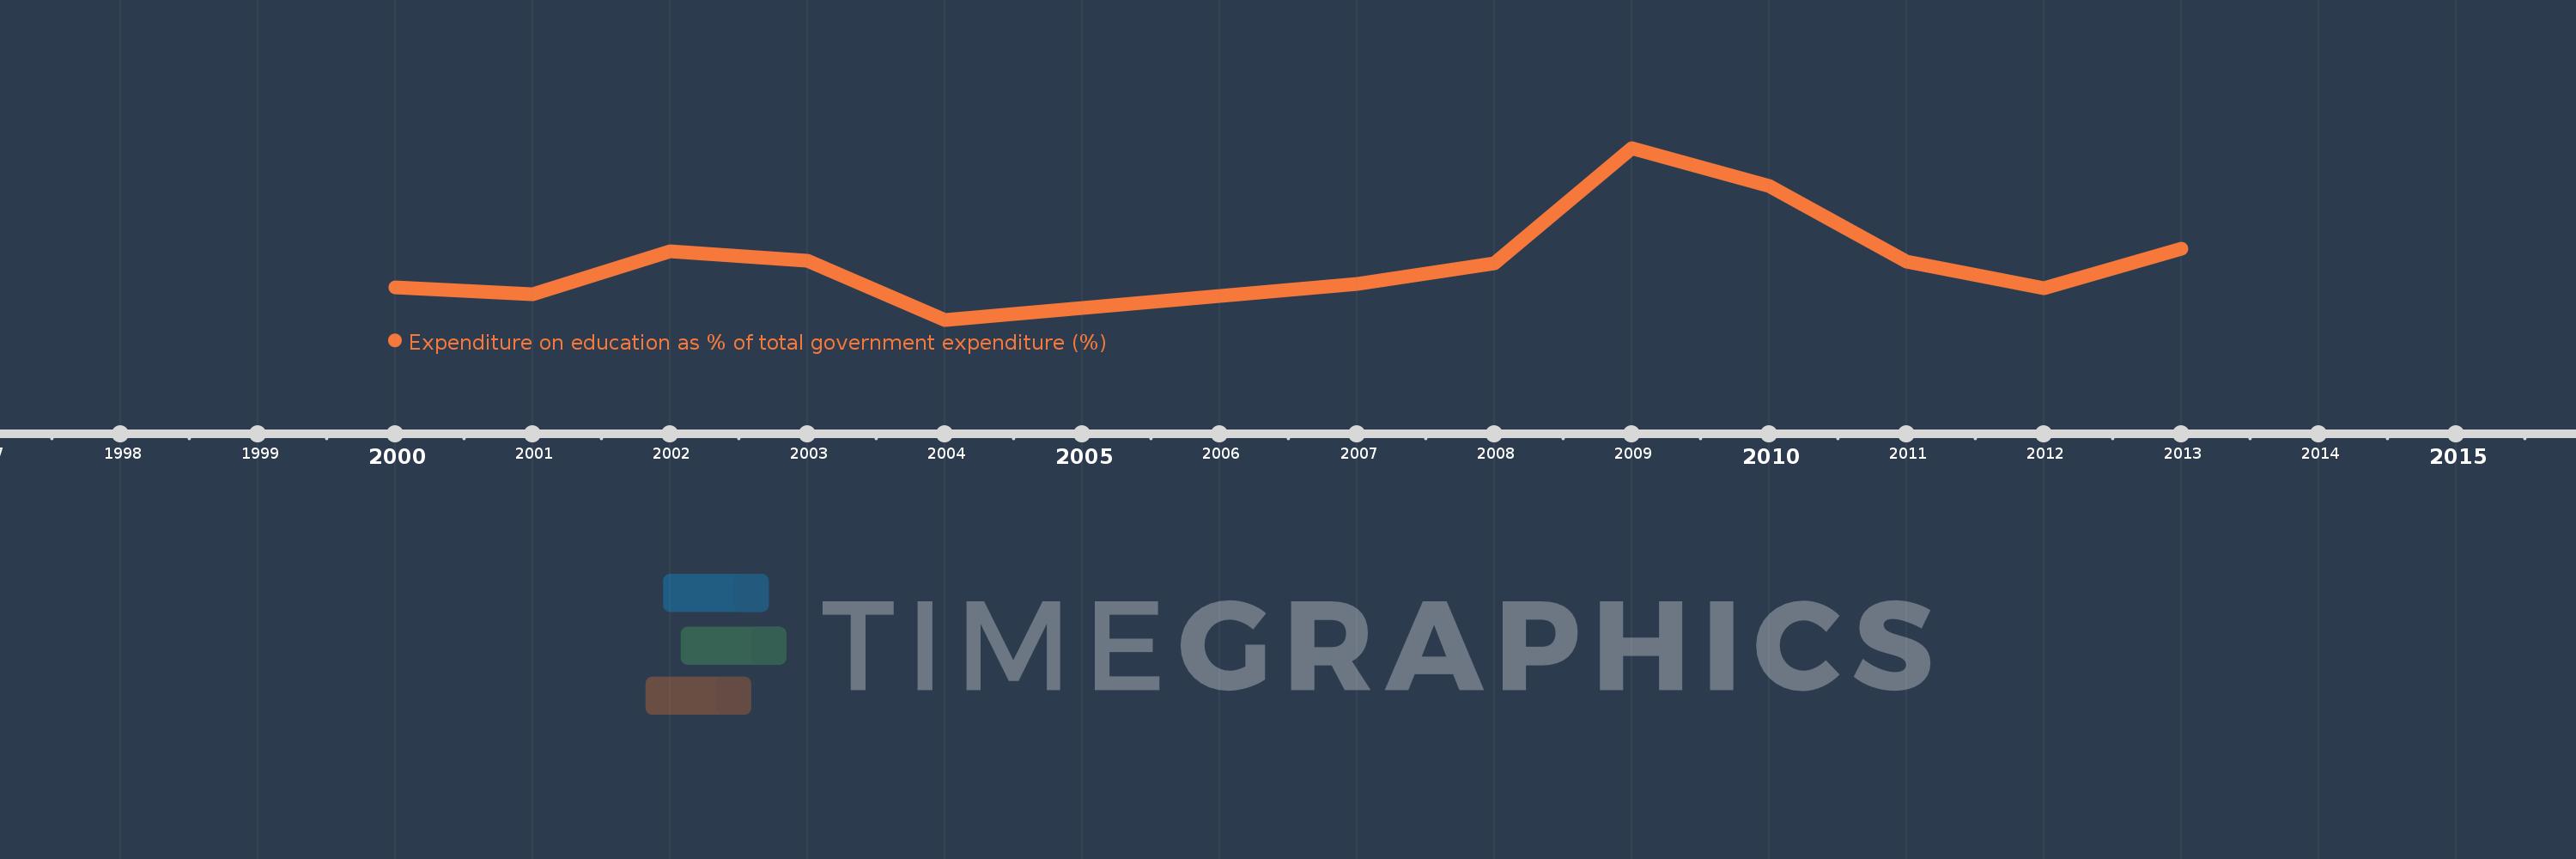
En esta escala de tiempo se presenta un gráfico de 2000 y 2013 de Latin America & Caribbean (excluding high income). Los datos de 1999 están ausentes. El número de observaciones reales por fecha: 12.

Fuente (nombre):

Indicadores del desarrollo mundial

Fuente (organización):

UNESCO Institute for Statistics

Categorías:

Education

Se ha actualizado:

23 abr 2017 año

Los indicadores de los cambios de valor en los últimos años

En promedio:
16.505
Mínimo:
15.212
1 ene 2004 año
Máximo:
18.8
1 ene 2009 año
A la fecha de observación
Valor
Cambio absoluto
El cambio con respecto al valor anterior
1 ene 2000 año
15.88
+15.88
0.0%
1 ene 2001 año
15.739
-0.141
-0.89%
1 ene 2002 año
16.639
+0.9
5.72%
1 ene 2003 año
16.443
-0.196
-1.18%
1 ene 2004 año
15.212
-1.231
-7.49%
1 ene 2007 año
15.962
+0.75
4.93%
1 ene 2008 año
16.384
+0.422
2.65%
1 ene 2009 año
18.8
+2.416
14.75%
1 ene 2010 año
18.013
-0.788
-4.19%
1 ene 2011 año
16.419
-1.594
-8.85%
1 ene 2012 año
15.873
-0.546
-3.33%
1 ene 2013 año
16.699
+0.827
5.21%

Ranking de los países por los datos estadísticos actuales