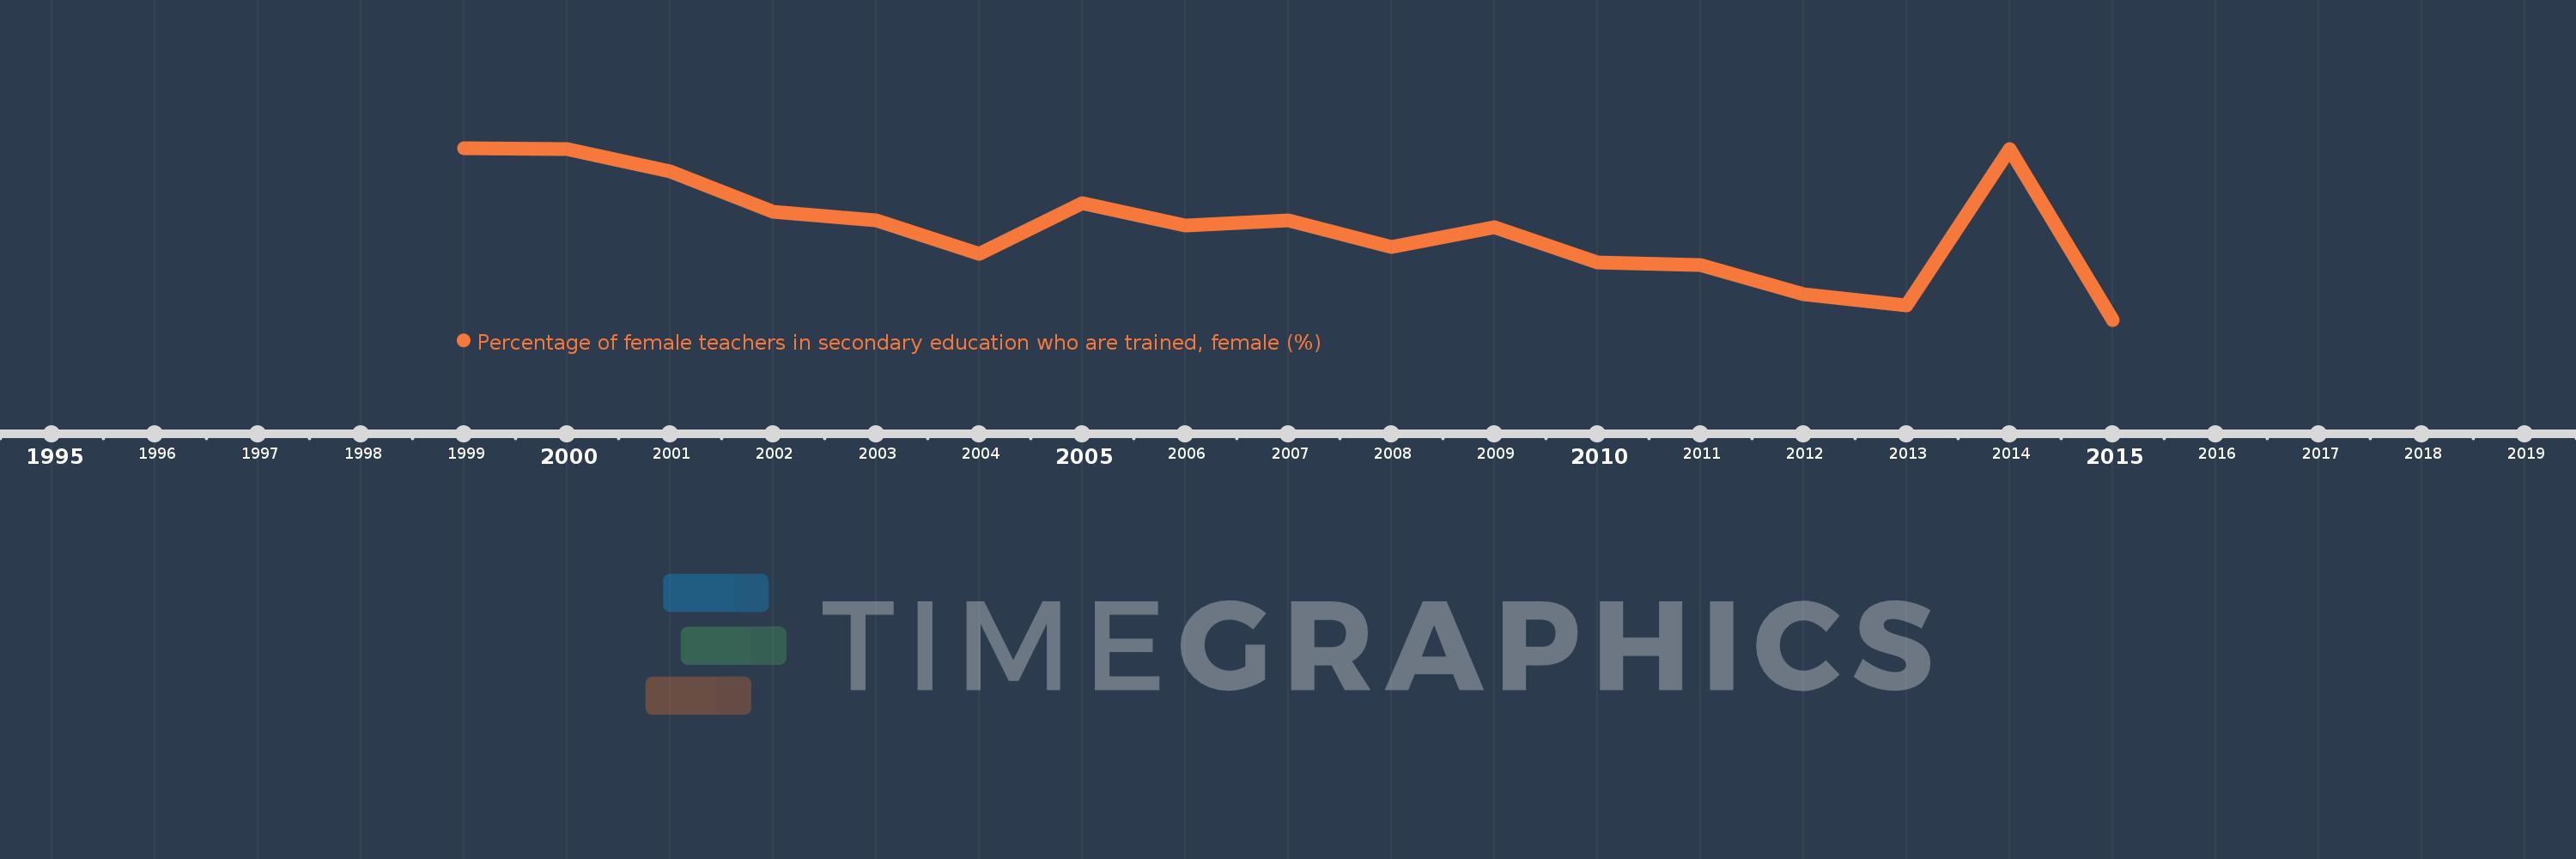
En esta escala de tiempo se presenta un gráfico de 1999 y 2015 de IDA only. Los datos de 1998 están ausentes. El número de observaciones reales por fecha: 17.
Fuente (nombre):
Indicadores del desarrollo mundial
Fuente (organización):
UNESCO Institute for Statistics
Categorías:
Education
Se ha actualizado:
23 abr 2017 año
Los indicadores de los cambios de valor en los últimos años
En promedio:
71.575
Mínimo:
65.727
1 ene 2015 año
Máximo:
76.671
1 ene 1999 año
A la fecha de observación
Valor
Cambio absoluto
El cambio con respecto al valor anterior
1 ene 1999 año
76.671
+76.671
0.0%
1 ene 2000 año
76.586
-0.085
-0.11%
1 ene 2001 año
75.198
-1.388
-1.81%
1 ene 2002 año
72.613
-2.585
-3.44%
1 ene 2003 año
72.07
-0.543
-0.75%
1 ene 2004 año
69.911
-2.159
-3.0%
1 ene 2005 año
73.133
+3.222
4.61%
1 ene 2006 año
71.74
-1.394
-1.91%
1 ene 2007 año
72.034
+0.295
0.41%
1 ene 2008 año
70.38
-1.655
-2.3%
1 ene 2009 año
71.6
+1.221
1.73%
1 ene 2010 año
69.351
-2.25
-3.14%
1 ene 2011 año
69.194
-0.156
-0.23%
1 ene 2012 año
67.337
-1.857
-2.68%
1 ene 2013 año
66.62
-0.717
-1.06%
1 ene 2014 año
76.604
+9.984
14.99%
1 ene 2015 año
65.727
-10.877
-14.2%
Ranking de los países por los datos estadísticos actuales