29
/es/
es
AIzaSyAYiBZKx7MnpbEhh9jyipgxe19OcubqV5w
April 1, 2024
39080
IDA only
IDX
false
2
1
Imports of goods and services (constant 2010 US$)
2016,2015,2014,2013,2012,2011,2010,2009,2008,2007,2006,2005,2004,2003,2002
Download
Estadísticas Globales de la Biblioteca →IDA only →

Imports of goods and services (constant 2010 US$)

Estas estadísticas en otros países:
AfghanistanAlbaniaAlgeriaAngolaAntigua and BarbudaArab WorldArgentinaArmeniaArubaAustraliaAustriaAzerbaijanBahamas, TheBahrainBangladeshBarbadosBelarusBelgiumBelizeBeninBermudaBhutanBoliviaBosnia and HerzegovinaBotswanaBrazilBrunei DarussalamBulgariaBurkina FasoBurundiCabo VerdeCambodiaCameroonCanadaCaribbean small statesCentral African RepublicCentral Europe and the BalticsChadChileChinaColombiaComorosCongo, Dem. Rep.Congo, Rep.Costa RicaCote d'IvoireCroatiaCubaCyprusCzech RepublicDenmarkDominicaDominican RepublicEarly-demographic dividendEast Asia & PacificEast Asia & Pacific (excluding high income)East Asia & Pacific (IDA & IBRD countries)EcuadorEgypt, Arab Rep.El SalvadorEquatorial GuineaEritreaEstoniaEuro areaEurope & Central AsiaEurope & Central Asia (excluding high income)Europe & Central Asia (IDA & IBRD countries)European UnionFaroe IslandsFijiFinlandFragile and conflict affected situationsFranceGabonGambia, TheGeorgiaGermanyGhanaGreeceGrenadaGuatemalaGuineaGuinea-BissauGuyanaHaitiHeavily indebted poor countries (HIPC)High incomeHondurasHong Kong SAR, ChinaHungaryIBRD onlyIcelandIDA & IBRD totalIDA blendIDA onlyIDA totalIndiaIndonesiaIran, Islamic Rep.IraqIrelandIsraelItalyJamaicaJapanJordanKazakhstanKenyaKiribatiKorea, Rep.KosovoKuwaitKyrgyz RepublicLao PDRLate-demographic dividendLatin America & Caribbean Latin America & Caribbean (excluding high income)Latin America & the Caribbean (IDA & IBRD countries)LatviaLeast developed countries: UN classificationLebanonLiberiaLibyaLithuaniaLow & middle incomeLow incomeLower middle incomeLuxembourgMacao SAR, ChinaMacedonia, FYRMadagascarMalawiMalaysiaMaldivesMaliMaltaMauritaniaMauritiusMexicoMiddle East & North AfricaMiddle East & North Africa (excluding high income)Middle East & North Africa (IDA & IBRD countries)Middle incomeMoldovaMongoliaMontenegroMoroccoMozambiqueMyanmarNamibiaNepalNetherlandsNew ZealandNicaraguaNigerNigeriaNorth AmericaNorwayOECD membersOmanOther small statesPacific island small statesPakistanPalauPanamaParaguayPeruPhilippinesPolandPortugalPost-demographic dividendPre-demographic dividendPuerto RicoQatarRomaniaRussian FederationRwandaSamoaSaudi ArabiaSenegalSerbiaSeychellesSierra LeoneSingaporeSlovak RepublicSloveniaSmall statesSolomon IslandsSouth AfricaSouth AsiaSouth Asia (IDA & IBRD)South SudanSpainSri LankaSt. Kitts and NevisSt. LuciaSt. Vincent and the GrenadinesSub-Saharan Africa Sub-Saharan Africa (excluding high income)Sub-Saharan Africa (IDA & IBRD countries)SudanSurinameSwazilandSwedenSwitzerlandTajikistanTanzaniaThailandTimor-LesteTogoTongaTrinidad and TobagoTunisiaTurkeyTurkmenistanUgandaUkraineUnited Arab EmiratesUnited KingdomUnited StatesUpper middle incomeUruguayUzbekistanVanuatuVenezuela, RBVietnamWest Bank and GazaWorldYemen, Rep.ZambiaZimbabwe
línea de tiempo (timeline):
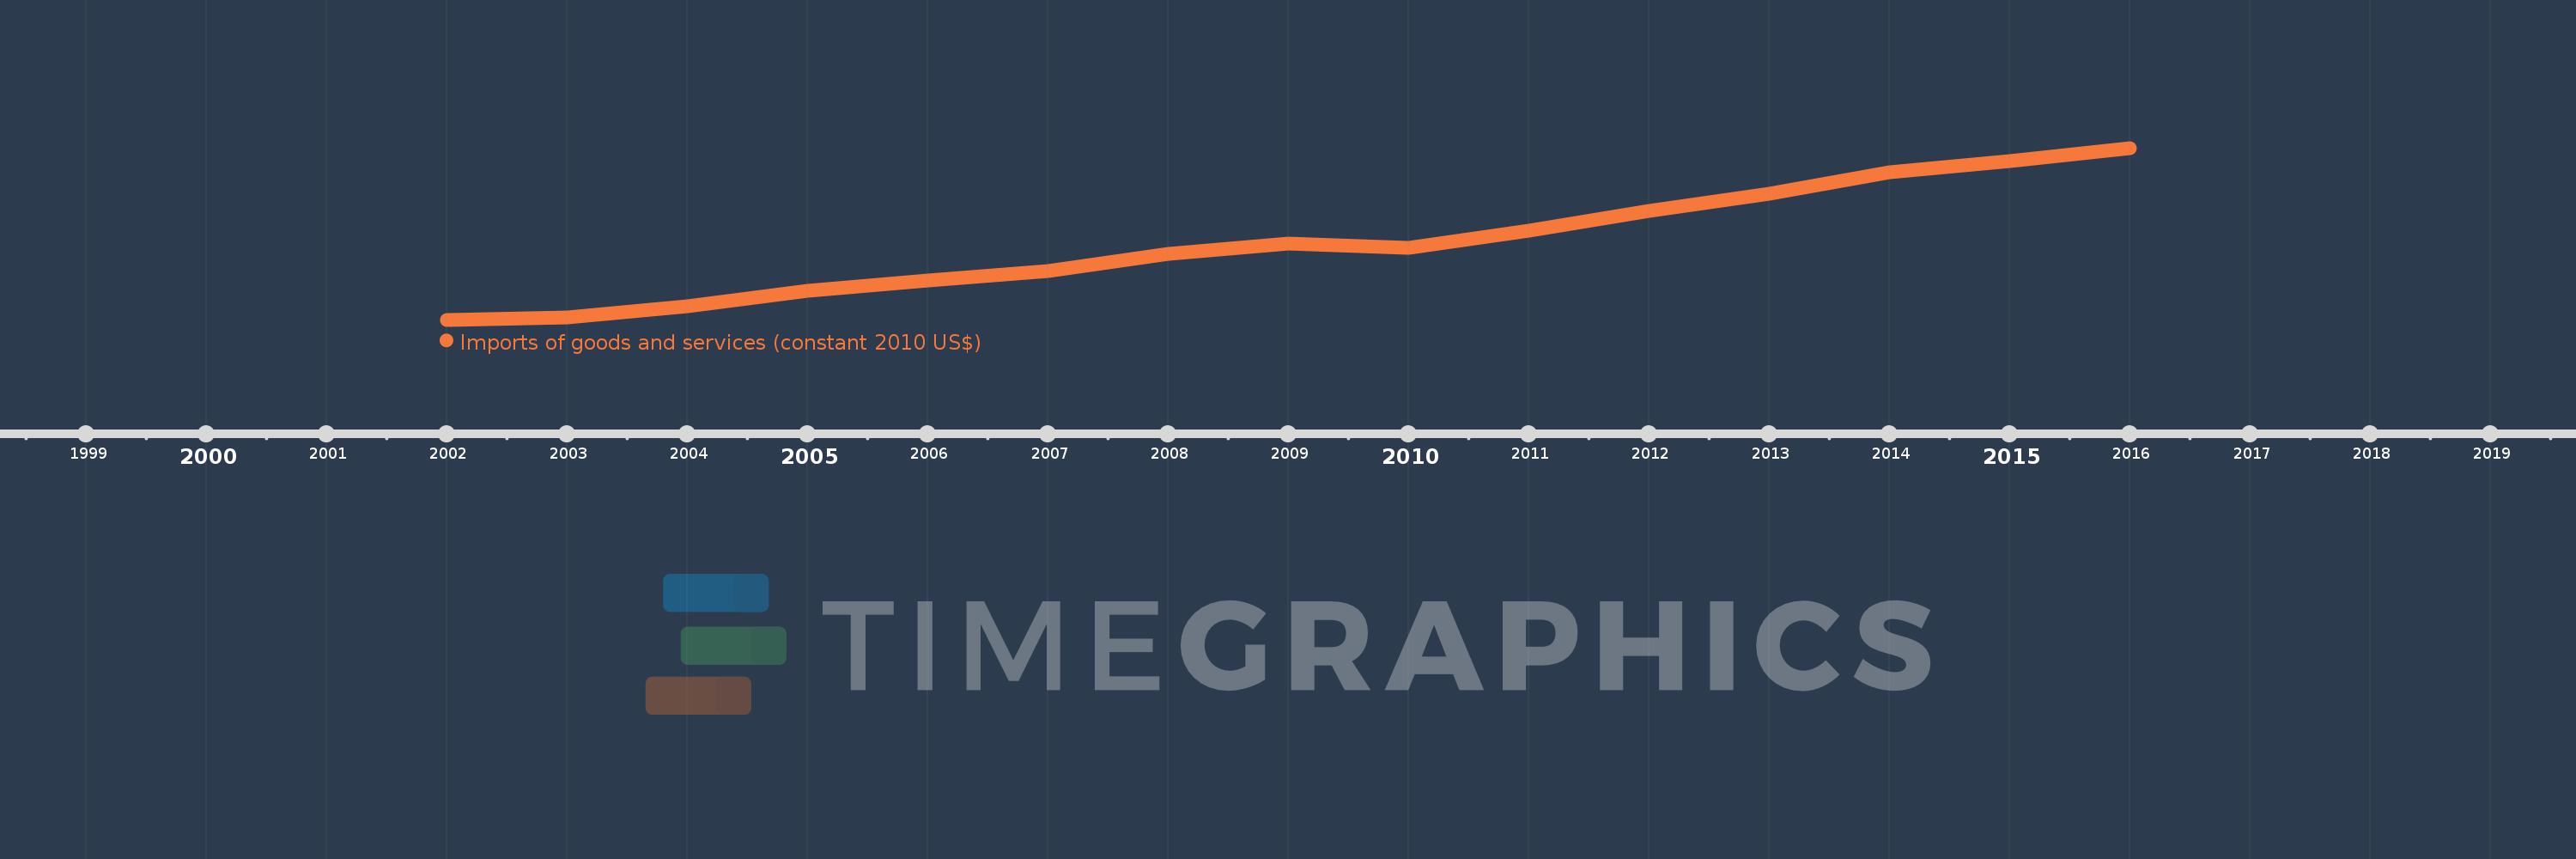
En esta escala de tiempo se presenta un gráfico de 2002 y 2016 de IDA only. Los datos de 2001 están ausentes. El número de observaciones reales por fecha: 15.
Fuente (nombre):
Indicadores del desarrollo mundial
Fuente (organización):
World Bank national accounts data, and OECD National Accounts data files.
Categorías:
Economy & Growth, Trade
Se ha actualizado:
23 abr 2017 año
Los indicadores de los cambios de valor en los últimos años
En promedio:
238.954 bn
Mínimo:
114.873 bn
1 ene 2002 año
Máximo:
393.564 bn
1 ene 2016 año
A la fecha de observación
Valor
Cambio absoluto
El cambio con respecto al valor anterior
1 ene 2002 año
114.873 bn
+114.873 bn
0.0%
1 ene 2003 año
119.115 bn
+4.242 bn
3.69%
1 ene 2004 año
136.717 bn
+17.602 bn
14.78%
1 ene 2005 año
161.197 bn
+24.48 bn
17.91%
1 ene 2006 año
178.888 bn
+17.691 bn
10.97%
1 ene 2007 año
194.441 bn
+15.553 bn
8.69%
1 ene 2008 año
221.464 bn
+27.024 bn
13.9%
1 ene 2009 año
238.354 bn
+16.89 bn
7.63%
1 ene 2010 año
230.82 bn
-7.534 bn
-3.16%
1 ene 2011 año
259.377 bn
+28.556 bn
12.37%
1 ene 2012 año
290.949 bn
+31.572 bn
12.17%
1 ene 2013 año
319.005 bn
+28.056 bn
9.64%
1 ene 2014 año
353.728 bn
+34.723 bn
10.88%
1 ene 2015 año
371.821 bn
+18.093 bn
5.11%
1 ene 2016 año
393.564 bn
+21.743 bn
5.85%
Ranking de los países por los datos estadísticos actuales

Comentarios:

Enviar
PremiumAbout & FeedbackAcuerdoPrivacidad
logo
© 2022 Selected Technologies LLC – Morgan Hill, California