33
/es/
AIzaSyAYiBZKx7MnpbEhh9jyipgxe19OcubqV5w
August 1, 2025
37688
IDA & IBRD total
IBT
false
2
1
Personal transfers, receipts (BoP, current US$)
2015,2014,2013,2012,2011,2010,2009,2008,2007,2006,2005,2004,2003
Download
Estadísticas Globales de la Biblioteca →IDA & IBRD total →

Personal transfers, receipts (BoP, current US$)

Estas estadísticas en otros países:

AfghanistanAlbaniaAlgeriaAngolaAntigua and BarbudaArgentinaArmeniaArubaAustriaAzerbaijanBangladeshBarbadosBelarusBelgiumBelizeBeninBermudaBhutanBoliviaBosnia and HerzegovinaBotswanaBrazilBulgariaBurkina FasoBurundiCabo VerdeCambodiaCameroonCaribbean small statesCentral Europe and the BalticsChadChinaColombiaComorosCongo, Rep.Costa RicaCote d'IvoireCroatiaCuracaoCyprusCzech RepublicDjiboutiDominicaDominican RepublicEarly-demographic dividendEast Asia & PacificEast Asia & Pacific (excluding high income)East Asia & Pacific (IDA & IBRD countries)EcuadorEgypt, Arab Rep.El SalvadorEstoniaEthiopiaEuro areaEurope & Central AsiaEurope & Central Asia (excluding high income)Europe & Central Asia (IDA & IBRD countries)European UnionFijiFragile and conflict affected situationsFranceFrench PolynesiaGabonGambia, TheGeorgiaGermanyGhanaGreeceGrenadaGuatemalaGuineaGuinea-BissauGuyanaHaitiHeavily indebted poor countries (HIPC)HondurasHungaryIBRD onlyIcelandIDA & IBRD totalIDA blendIDA onlyIDA totalIndiaIndonesiaIraqIrelandItalyJamaicaJapanJordanKazakhstanKenyaKiribatiKorea, Rep.KosovoKyrgyz RepublicLao PDRLate-demographic dividendLatin America & Caribbean Latin America & Caribbean (excluding high income)Latin America & the Caribbean (IDA & IBRD countries)LatviaLeast developed countries: UN classificationLebanonLesothoLiberiaLibyaLithuaniaLow & middle incomeLow incomeLower middle incomeLuxembourgMacao SAR, ChinaMacedonia, FYRMadagascarMalawiMaldivesMaliMaltaMarshall IslandsMauritaniaMexicoMicronesia, Fed. Sts.Middle East & North Africa (excluding high income)Middle East & North Africa (IDA & IBRD countries)Middle incomeMoldovaMongoliaMontenegroMoroccoMozambiqueMyanmarNamibiaNepalNetherlandsNew CaledoniaNew ZealandNicaraguaNigerNigeriaNorwayOECD membersOmanOther small statesPacific island small statesPakistanPalauPanamaPapua New GuineaParaguayPeruPhilippinesPolandPortugalPost-demographic dividendPre-demographic dividendQatarRomaniaRussian FederationRwandaSamoaSao Tome and PrincipeSenegalSerbiaSeychellesSierra LeoneSint Maarten (Dutch part)Slovak RepublicSloveniaSmall statesSolomon IslandsSouth AsiaSouth Asia (IDA & IBRD)SpainSri LankaSt. Kitts and NevisSt. LuciaSt. Vincent and the GrenadinesSub-Saharan Africa Sub-Saharan Africa (excluding high income)Sub-Saharan Africa (IDA & IBRD countries)SudanSurinameSwazilandSwedenSwitzerlandSyrian Arab RepublicTajikistanTanzaniaThailandTimor-LesteTogoTongaTrinidad and TobagoTunisiaTurkeyTuvaluUgandaUkraineUnited KingdomUpper middle incomeUruguayVanuatuVenezuela, RBWest Bank and GazaWorldYemen, Rep.ZambiaZimbabwe

línea de tiempo (timeline):

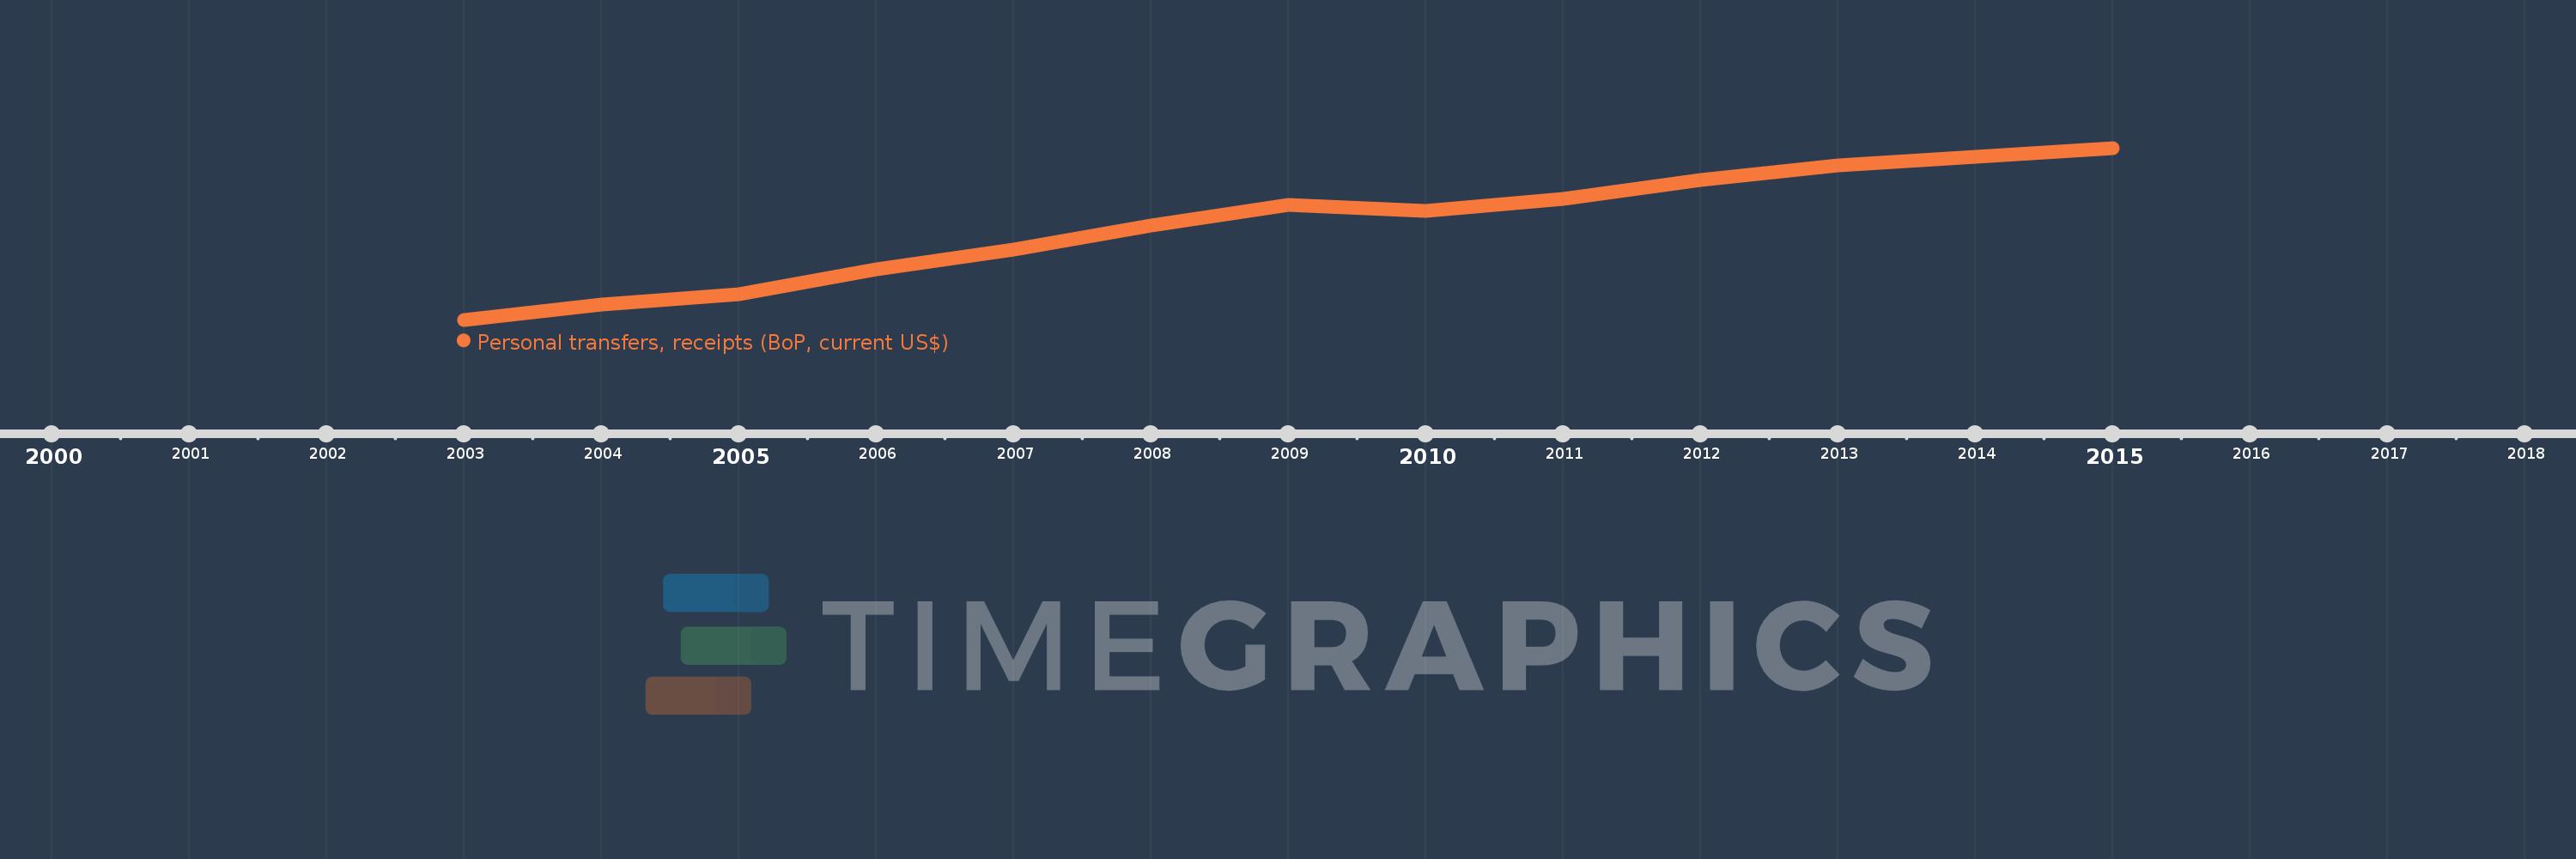
En esta escala de tiempo se presenta un gráfico de 2003 y 2015 de IDA & IBRD total. Los datos de 2002 están ausentes. El número de observaciones reales por fecha: 13.

Fuente (nombre):

Indicadores del desarrollo mundial

Fuente (organización):

International Monetary Fund, Balance of Payments Statistics Yearbook and data files.

Categorías:

Economy & Growth, Financial Sector

Se ha actualizado:

23 abr 2017 año

Los indicadores de los cambios de valor en los últimos años

En promedio:
211.958 bn
Mínimo:
81.458 bn
1 ene 2003 año
Máximo:
318.828 bn
1 ene 2015 año
A la fecha de observación
Valor
Cambio absoluto
El cambio con respecto al valor anterior
1 ene 2003 año
81.458 bn
+81.458 bn
0.0%
1 ene 2004 año
101.993 bn
+20.535 bn
25.21%
1 ene 2005 año
116.118 bn
+14.125 bn
13.85%
1 ene 2006 año
150.734 bn
+34.616 bn
29.81%
1 ene 2007 año
178.566 bn
+27.832 bn
18.46%
1 ene 2008 año
211.335 bn
+32.77 bn
18.35%
1 ene 2009 año
239.887 bn
+28.552 bn
13.51%
1 ene 2010 año
231.45 bn
-8.436 bn
-3.52%
1 ene 2011 año
248.875 bn
+17.424 bn
7.53%
1 ene 2012 año
275.035 bn
+26.16 bn
10.51%
1 ene 2013 año
294.21 bn
+19.175 bn
6.97%
1 ene 2014 año
306.971 bn
+12.762 bn
4.34%
1 ene 2015 año
318.828 bn
+11.857 bn
3.86%

Ranking de los países por los datos estadísticos actuales