33
/es/
AIzaSyAYiBZKx7MnpbEhh9jyipgxe19OcubqV5w
August 1, 2025
36697
IBRD only
IBD
false
2
1
Investment in telecoms with private participation (current US$)
2015,2014,2013,2012,2011,2010,2009,2008,2007,2006,2005,2004,2003,2002,2001,2000,1998
Download
Estadísticas Globales de la Biblioteca →IBRD only →

Investment in telecoms with private participation (current US$)

Estas estadísticas en otros países:

AfghanistanAlbaniaAlgeriaAmerican SamoaAngolaAntigua and BarbudaArgentinaArmeniaAzerbaijanBangladeshBelarusBelizeBeninBhutanBoliviaBosnia and HerzegovinaBotswanaBrazilBulgariaBurkina FasoBurundiCabo VerdeCambodiaCameroonCentral African RepublicChadChileChinaColombiaCongo, Dem. Rep.Congo, Rep.Costa RicaCote d'IvoireCubaDominicaDominican RepublicEarly-demographic dividendEast Asia & Pacific (excluding high income)East Asia & Pacific (IDA & IBRD countries)EcuadorEgypt, Arab Rep.El SalvadorEritreaEthiopiaEurope & Central Asia (excluding high income)Europe & Central Asia (IDA & IBRD countries)FijiFragile and conflict affected situationsGabonGambia, TheGeorgiaGhanaGrenadaGuatemalaGuineaGuinea-BissauGuyanaHaitiHeavily indebted poor countries (HIPC)HondurasIBRD onlyIDA & IBRD totalIDA blendIDA onlyIDA totalIndiaIndonesiaIran, Islamic Rep.IraqJamaicaJordanKazakhstanKenyaKiribatiKorea, Dem. People’s Rep.KosovoKyrgyz RepublicLao PDRLate-demographic dividendLatin America & Caribbean Latin America & Caribbean (excluding high income)Latin America & the Caribbean (IDA & IBRD countries)Least developed countries: UN classificationLebanonLesothoLiberiaLithuaniaLow & middle incomeLow incomeLower middle incomeMacedonia, FYRMadagascarMalawiMalaysiaMaldivesMaliMauritaniaMauritiusMexicoMicronesia, Fed. Sts.Middle East & North Africa (excluding high income)Middle East & North Africa (IDA & IBRD countries)Middle incomeMoldovaMongoliaMontenegroMoroccoMozambiqueMyanmarNamibiaNepalNicaraguaNigerNigeriaOther small statesPacific island small statesPakistanPanamaPapua New GuineaParaguayPeruPhilippinesPre-demographic dividendRomaniaRussian FederationRwandaSamoaSenegalSerbiaSeychellesSierra LeoneSomaliaSouth AfricaSouth AsiaSouth Asia (IDA & IBRD)South SudanSri LankaSt. Kitts and NevisSt. LuciaSt. Vincent and the GrenadinesSub-Saharan Africa Sub-Saharan Africa (excluding high income)Sub-Saharan Africa (IDA & IBRD countries)SudanSurinameSwazilandSyrian Arab RepublicTajikistanTanzaniaThailandTimor-LesteTogoTongaTunisiaTurkeyTurkmenistanUgandaUkraineUpper middle incomeUruguayUzbekistanVanuatuVenezuela, RBVietnamWest Bank and GazaYemen, Rep.ZambiaZimbabwe

línea de tiempo (timeline):

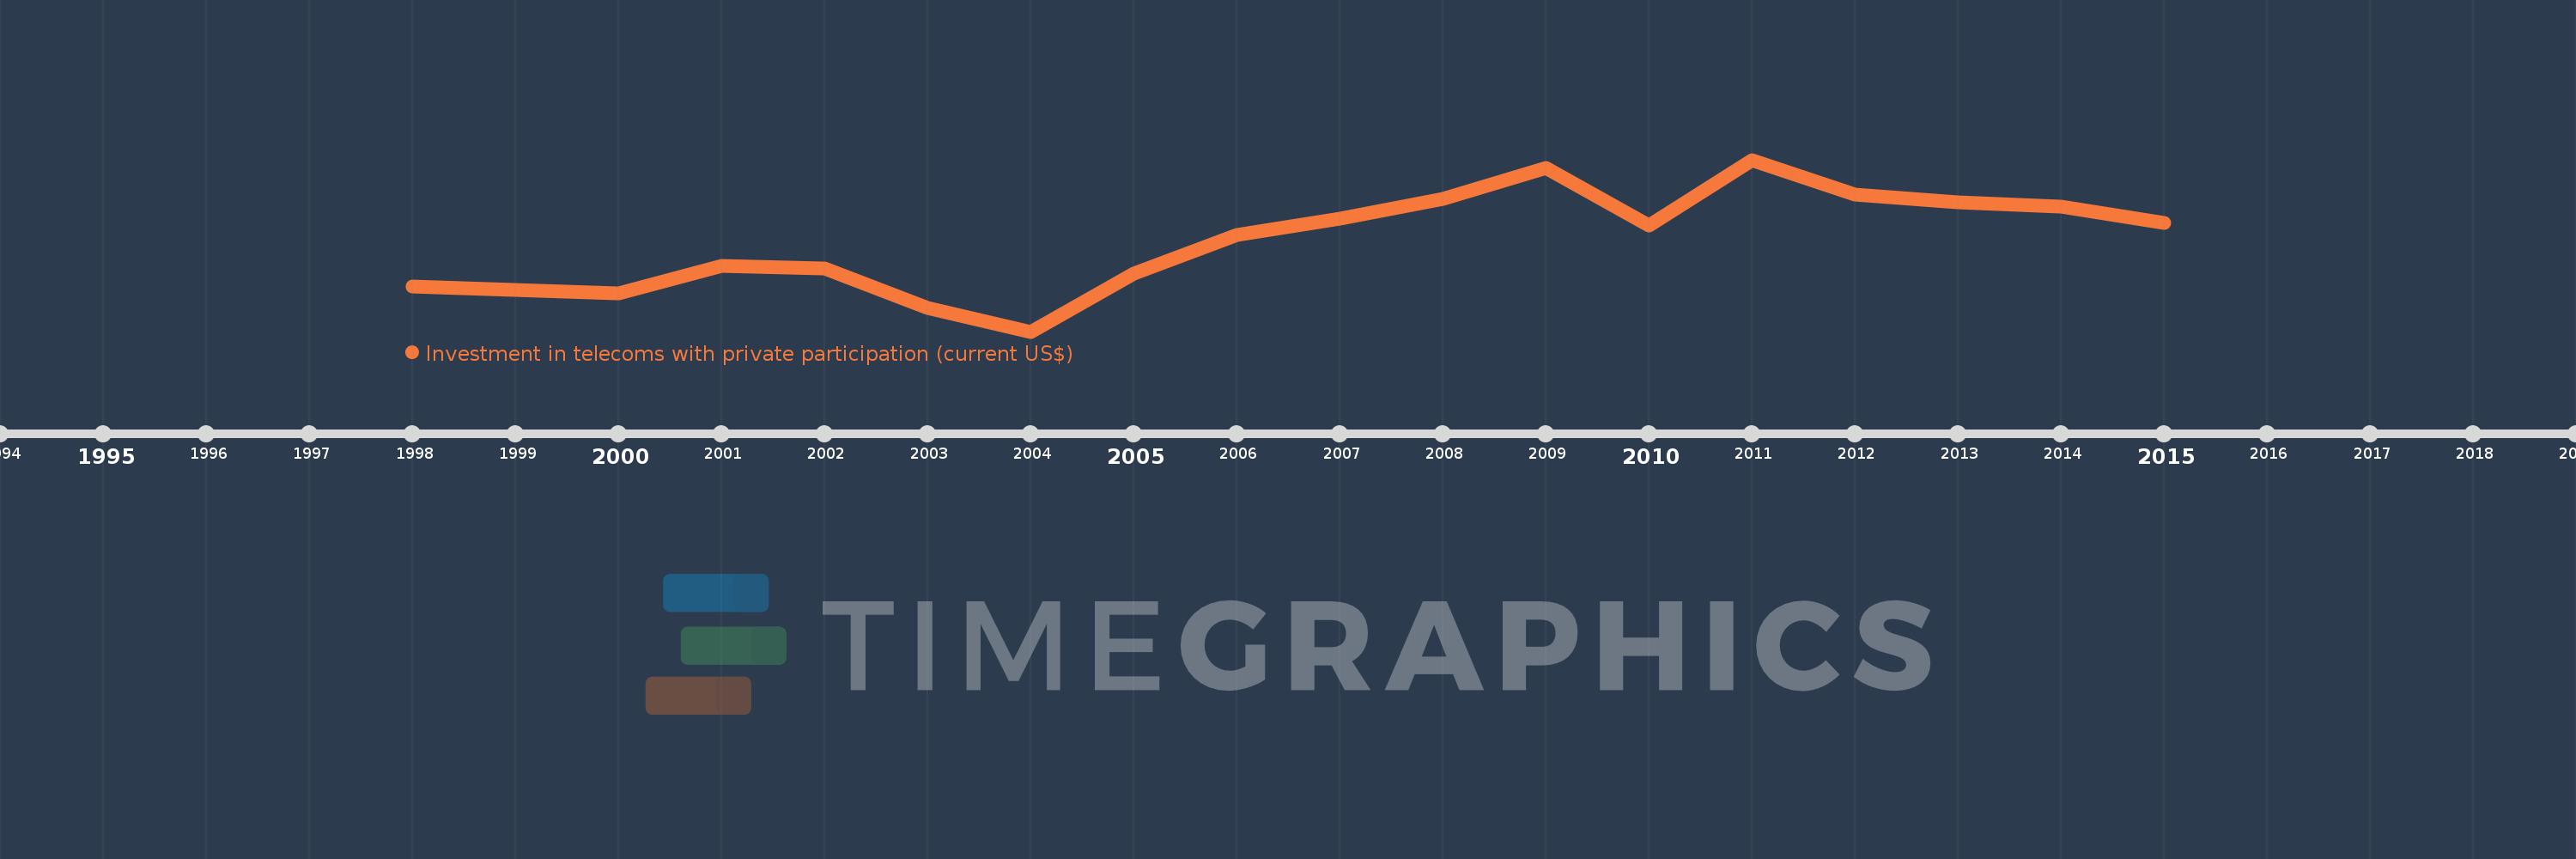
En esta escala de tiempo se presenta un gráfico de 1998 y 2015 de IBRD only. Los datos de 1997 están ausentes. El número de observaciones reales por fecha: 17.

Fuente (nombre):

Indicadores del desarrollo mundial

Fuente (organización):

World Bank, Private Participation in Infrastructure Project Database (http://ppi.worldbank.org).

Categorías:

Infrastructure, Private Sector

Se ha actualizado:

23 abr 2017 año

Los indicadores de los cambios de valor en los últimos años

En promedio:
44.333 bn
Mínimo:
21.17 bn
1 ene 2004 año
Máximo:
64.06 bn
1 ene 2011 año
A la fecha de observación
Valor
Cambio absoluto
El cambio con respecto al valor anterior
1 ene 1998 año
32.391 bn
+32.391 bn
0.0%
1 ene 2000 año
30.613 bn
-1.779 bn
-5.49%
1 ene 2001 año
37.54 bn
+6.928 bn
22.63%
1 ene 2002 año
36.98 bn
-560.16 millones
-1.49%
1 ene 2003 año
27.002 bn
-9.978 bn
-26.98%
1 ene 2004 año
21.17 bn
-5.833 bn
-21.6%
1 ene 2005 año
35.613 bn
+14.443 bn
68.23%
1 ene 2006 año
45.385 bn
+9.773 bn
27.44%
1 ene 2007 año
49.375 bn
+3.99 bn
8.79%
1 ene 2008 año
54.196 bn
+4.82 bn
9.76%
1 ene 2009 año
62.124 bn
+7.928 bn
14.63%
1 ene 2010 año
47.651 bn
-14.473 bn
-23.3%
1 ene 2011 año
64.06 bn
+16.409 bn
34.44%
1 ene 2012 año
55.351 bn
-8.709 bn
-13.6%
1 ene 2013 año
53.449 bn
-1.902 bn
-3.44%
1 ene 2014 año
52.417 bn
-1.032 bn
-1.93%
1 ene 2015 año
48.345 bn
-4.072 bn
-7.77%

Ranking de los países por los datos estadísticos actuales