30
/es/
AIzaSyAYiBZKx7MnpbEhh9jyipgxe19OcubqV5w
April 1, 2024
36648
IBRD only
IBD
false
2
1
ICT service exports (BoP, current US$)
2016,2015,2014,2013,2012,2011,2010,2009,2008,2007,2006,2005,2004,2003,2002,2001,2000
Download
Estadísticas Globales de la Biblioteca →IBRD only →

ICT service exports (BoP, current US$)

Estas estadísticas en otros países:

AfghanistanAlbaniaAlgeriaAngolaAntigua and BarbudaArab WorldArgentinaArmeniaArubaAustraliaAustriaAzerbaijanBahrainBangladeshBarbadosBelarusBelgiumBelizeBeninBermudaBhutanBoliviaBosnia and HerzegovinaBotswanaBrazilBrunei DarussalamBulgariaBurkina FasoBurundiCabo VerdeCambodiaCameroonCanadaCaribbean small statesCentral Europe and the BalticsChileChinaColombiaComorosCongo, Dem. Rep.Congo, Rep.Costa RicaCote d'IvoireCroatiaCuracaoCyprusCzech RepublicDenmarkDjiboutiDominicaDominican RepublicEarly-demographic dividendEast Asia & PacificEast Asia & Pacific (excluding high income)East Asia & Pacific (IDA & IBRD countries)EcuadorEgypt, Arab Rep.El SalvadorEritreaEstoniaEthiopiaEuro areaEurope & Central AsiaEurope & Central Asia (excluding high income)Europe & Central Asia (IDA & IBRD countries)European UnionFaroe IslandsFijiFinlandFragile and conflict affected situationsFranceFrench PolynesiaGabonGambia, TheGeorgiaGermanyGreeceGrenadaGuatemalaGuineaGuinea-BissauGuyanaHeavily indebted poor countries (HIPC)High incomeHondurasHong Kong SAR, ChinaHungaryIBRD onlyIcelandIDA & IBRD totalIDA blendIDA onlyIDA totalIndiaIndonesiaIraqIrelandIsraelItalyJamaicaJapanJordanKazakhstanKenyaKorea, Rep.KosovoKuwaitKyrgyz RepublicLao PDRLate-demographic dividendLatin America & Caribbean Latin America & Caribbean (excluding high income)Latin America & the Caribbean (IDA & IBRD countries)LatviaLeast developed countries: UN classificationLebanonLesothoLithuaniaLow & middle incomeLow incomeLower middle incomeLuxembourgMacao SAR, ChinaMacedonia, FYRMadagascarMalawiMalaysiaMaliMaltaMauritaniaMauritiusMexicoMicronesia, Fed. Sts.Middle East & North AfricaMiddle East & North Africa (excluding high income)Middle East & North Africa (IDA & IBRD countries)Middle incomeMoldovaMongoliaMontenegroMoroccoMozambiqueMyanmarNamibiaNepalNetherlandsNew CaledoniaNew ZealandNicaraguaNigerNigeriaNorth AmericaNorwayOECD membersOmanPacific island small statesPakistanPalauPanamaPapua New GuineaParaguayPeruPhilippinesPolandPortugalPost-demographic dividendPre-demographic dividendRomaniaRussian FederationRwandaSamoaSao Tome and PrincipeSaudi ArabiaSenegalSerbiaSeychellesSierra LeoneSingaporeSint Maarten (Dutch part)Slovak RepublicSloveniaSmall statesSolomon IslandsSouth AfricaSouth AsiaSouth Asia (IDA & IBRD)South SudanSpainSri LankaSt. Kitts and NevisSt. LuciaSt. Vincent and the GrenadinesSub-Saharan Africa Sub-Saharan Africa (excluding high income)Sub-Saharan Africa (IDA & IBRD countries)SudanSurinameSwazilandSwedenSwitzerlandSyrian Arab RepublicTajikistanTanzaniaThailandTogoTongaTrinidad and TobagoTunisiaTurkeyTuvaluUgandaUkraineUnited KingdomUnited StatesUpper middle incomeUruguayVanuatuVenezuela, RBWest Bank and GazaWorldYemen, Rep.ZambiaZimbabwe

línea de tiempo (timeline):

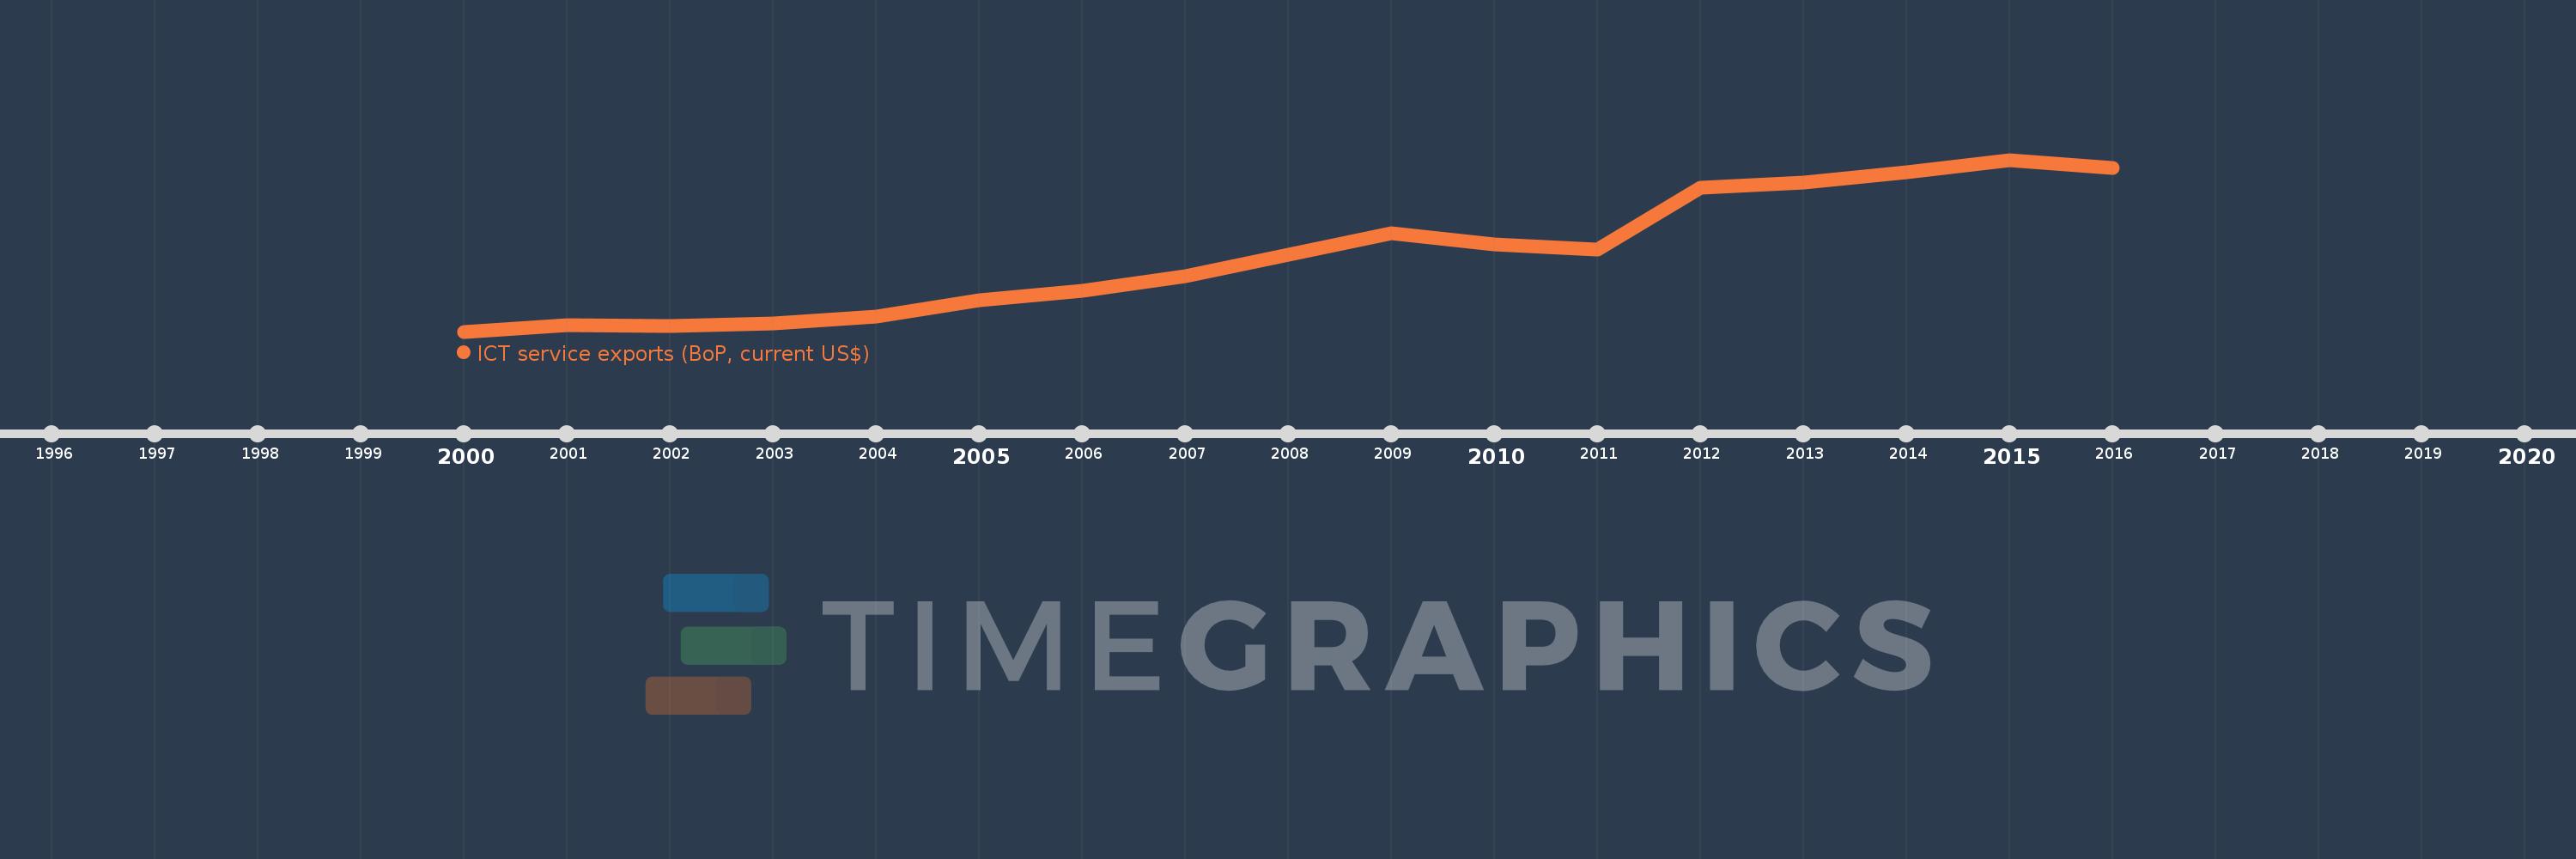
En esta escala de tiempo se presenta un gráfico de 2000 y 2016 de IBRD only. Los datos de 1999 están ausentes. El número de observaciones reales por fecha: 17.

Fuente (nombre):

Indicadores del desarrollo mundial

Fuente (organización):

International Monetary Fund, Balance of Payments Statistics Yearbook and data files.

Categorías:

Economy & Growth, Infrastructure, Trade

Se ha actualizado:

23 abr 2017 año

Los indicadores de los cambios de valor en los últimos años

En promedio:
174.892 bn
Mínimo:
34.725 bn
1 ene 2000 año
Máximo:
350.892 bn
1 ene 2015 año
A la fecha de observación
Valor
Cambio absoluto
El cambio con respecto al valor anterior
1 ene 2000 año
34.725 bn
+34.725 bn
0.0%
1 ene 2001 año
46.275 bn
+11.55 bn
33.26%
1 ene 2002 año
45.549 bn
-725.479 millones
-1.57%
1 ene 2003 año
50.487 bn
+4.938 bn
10.84%
1 ene 2004 año
62.573 bn
+12.086 bn
23.94%
1 ene 2005 año
92.351 bn
+29.778 bn
47.59%
1 ene 2006 año
109.476 bn
+17.125 bn
18.54%
1 ene 2007 año
136.466 bn
+26.991 bn
24.65%
1 ene 2008 año
176.507 bn
+40.041 bn
29.34%
1 ene 2009 año
216.37 bn
+39.862 bn
22.58%
1 ene 2010 año
194.504 bn
-21.866 bn
-10.11%
1 ene 2011 año
185.0 bn
-9.504 bn
-4.89%
1 ene 2012 año
299.089 bn
+114.089 bn
61.67%
1 ene 2013 año
308.825 bn
+9.736 bn
3.26%
1 ene 2014 año
328.103 bn
+19.279 bn
6.24%
1 ene 2015 año
350.892 bn
+22.788 bn
6.95%
1 ene 2016 año
335.979 bn
-14.913 bn
-4.25%

Ranking de los países por los datos estadísticos actuales