29
/es/
es
AIzaSyAYiBZKx7MnpbEhh9jyipgxe19OcubqV5w
April 1, 2024
36495
IBRD only
IBD
false
2
1
Employment in agriculture (% of total employment)
2012,2011,2010,2009,2008,2007,2006,2005,2004,2003,2002,2001,1997,1995,1994,1993
Download
Estadísticas Globales de la Biblioteca →IBRD only →

Employment in agriculture (% of total employment)

Estas estadísticas en otros países:
AlbaniaAlgeriaAmerican SamoaAngolaAntigua and BarbudaArab WorldArgentinaArmeniaArubaAustraliaAustriaAzerbaijanBahamas, TheBahrainBangladeshBarbadosBelarusBelgiumBelizeBeninBermudaBhutanBoliviaBotswanaBrazilBritish Virgin IslandsBrunei DarussalamBulgariaBurkina FasoBurundiCambodiaCameroonCanadaCaribbean small statesCayman IslandsCentral Europe and the BalticsChadChileChinaColombiaCongo, Rep.Costa RicaCroatiaCubaCyprusCzech RepublicDenmarkDominicaDominican RepublicEarly-demographic dividendEast Asia & PacificEast Asia & Pacific (excluding high income)East Asia & Pacific (IDA & IBRD countries)EcuadorEgypt, Arab Rep.El SalvadorEquatorial GuineaEstoniaEthiopiaEuro areaEurope & Central AsiaEurope & Central Asia (excluding high income)Europe & Central Asia (IDA & IBRD countries)European UnionFaroe IslandsFijiFinlandFranceFrench PolynesiaGabonGambia, TheGeorgiaGermanyGhanaGreeceGreenlandGrenadaGuamGuatemalaGuineaGuyanaHaitiHigh incomeHondurasHong Kong SAR, ChinaHungaryIBRD onlyIcelandIDA & IBRD totalIDA blendIndiaIndonesiaIran, Islamic Rep.IraqIrelandIsle of ManIsraelItalyJamaicaJapanJordanKazakhstanKenyaKiribatiKorea, Rep.KosovoKuwaitKyrgyz RepublicLao PDRLate-demographic dividendLatin America & Caribbean Latin America & Caribbean (excluding high income)Latin America & the Caribbean (IDA & IBRD countries)LatviaLesothoLiberiaLibyaLithuaniaLow & middle incomeLower middle incomeLuxembourgMacao SAR, ChinaMacedonia, FYRMadagascarMalawiMalaysiaMaldivesMaliMaltaMarshall IslandsMauritiusMexicoMiddle East & North AfricaMiddle East & North Africa (excluding high income)Middle East & North Africa (IDA & IBRD countries)Middle incomeMoldovaMongoliaMontenegroMoroccoMozambiqueMyanmarNamibiaNepalNetherlandsNew CaledoniaNew ZealandNicaraguaNigerNigeriaNorth AmericaNorthern Mariana IslandsNorwayOECD membersOmanPakistanPalauPanamaPapua New GuineaParaguayPeruPhilippinesPolandPortugalPost-demographic dividendPuerto RicoQatarRomaniaRussian FederationRwandaSamoaSan MarinoSao Tome and PrincipeSaudi ArabiaSenegalSerbiaSeychellesSierra LeoneSingaporeSlovak RepublicSloveniaSouth AfricaSouth AsiaSouth Asia (IDA & IBRD)SpainSri LankaSt. Kitts and NevisSt. LuciaSt. Vincent and the GrenadinesSudanSurinameSwedenSwitzerlandSyrian Arab RepublicTajikistanTanzaniaThailandTimor-LesteTogoTongaTrinidad and TobagoTunisiaTurkeyTurks and Caicos IslandsUgandaUkraineUnited Arab EmiratesUnited KingdomUnited StatesUpper middle incomeUruguayUzbekistanVanuatuVenezuela, RBVietnamWest Bank and GazaWorldYemen, Rep.ZambiaZimbabwe
línea de tiempo (timeline):
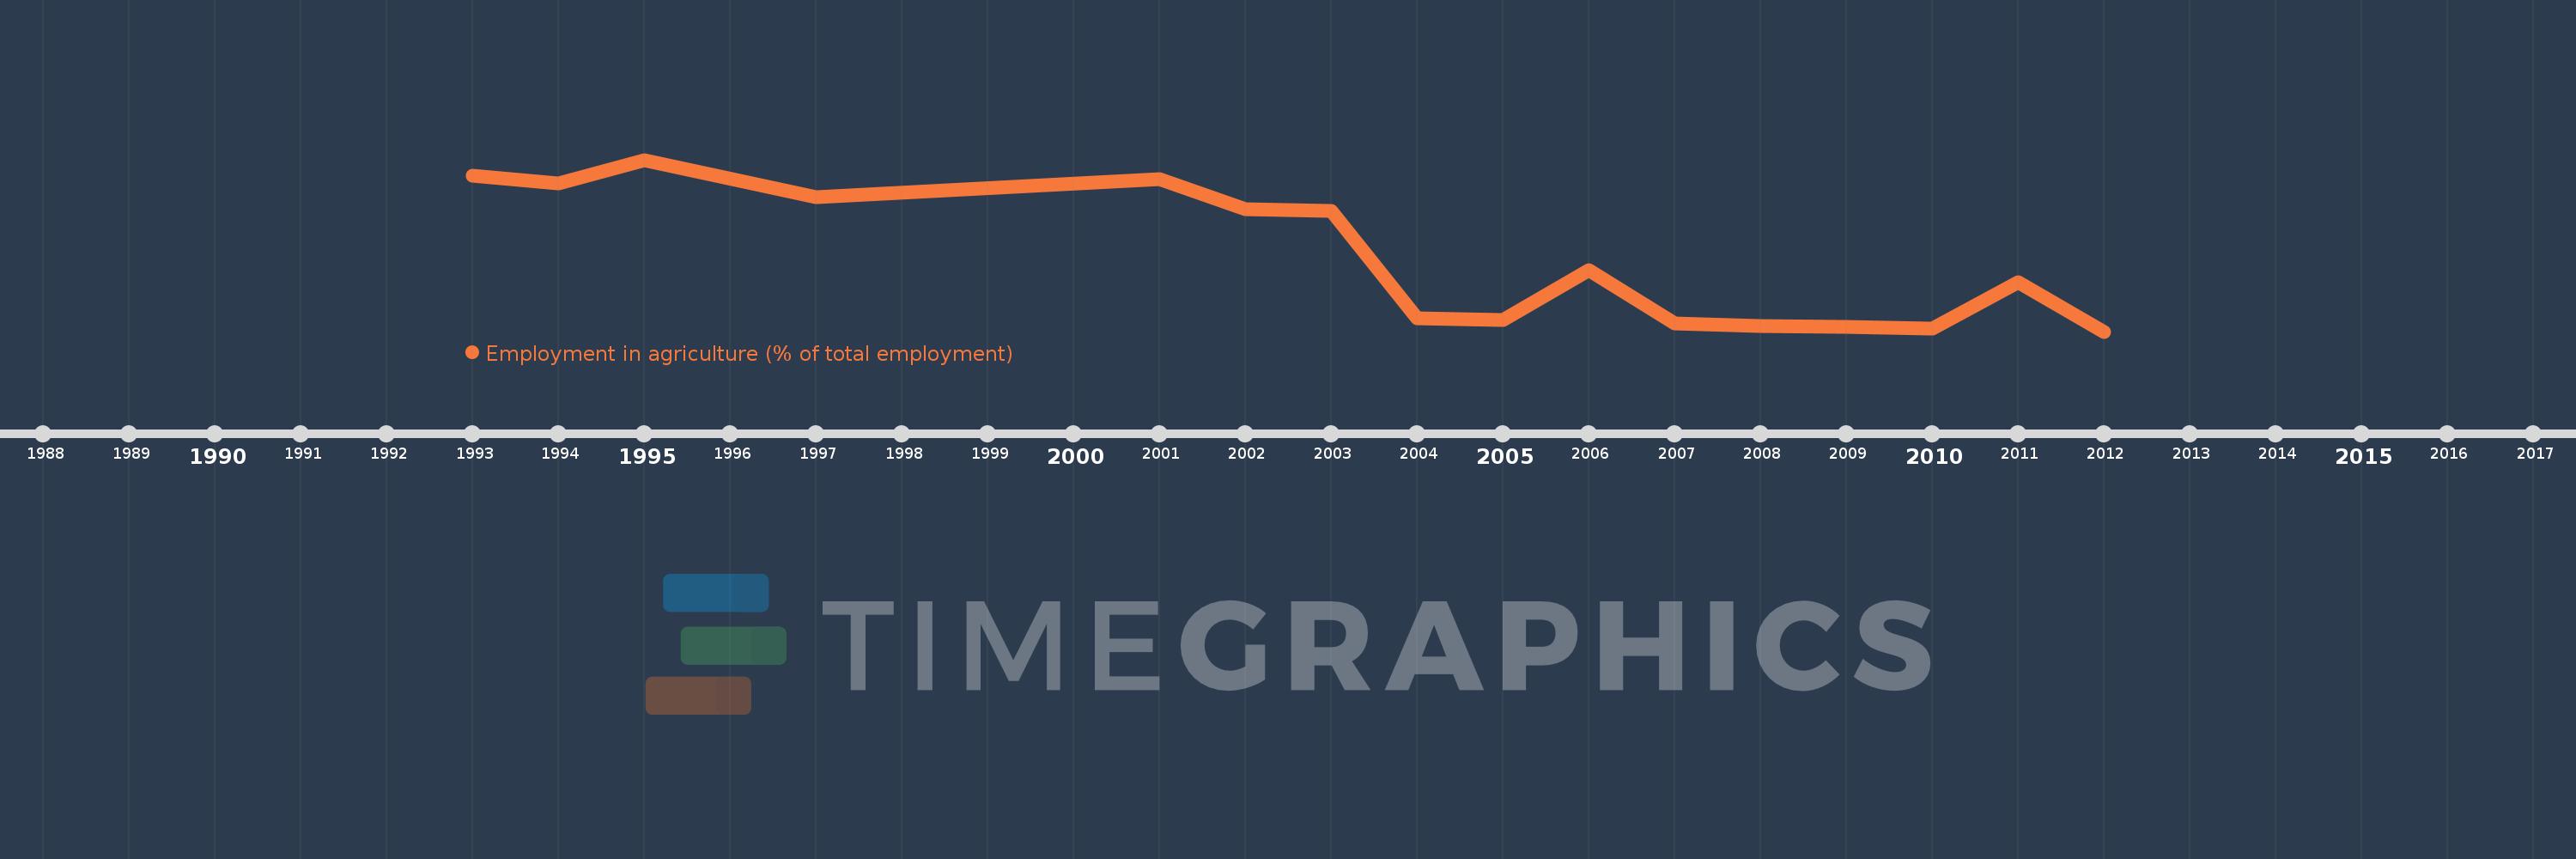
En esta escala de tiempo se presenta un gráfico de 1993 y 2012 de IBRD only. Los datos de 1992 están ausentes. El número de observaciones reales por fecha: 16.
Fuente (nombre):
Indicadores del desarrollo mundial
Fuente (organización):
International Labour Organization, Key Indicators of the Labour Market database.
Categorías:
Agriculture & Rural Development, Social Protection & Labor
Se ha actualizado:
23 abr 2017 año
Los indicadores de los cambios de valor en los últimos años
En promedio:
26.401
Mínimo:
11.484
1 ene 2012 año
Máximo:
46.799
1 ene 1995 año
A la fecha de observación
Valor
Cambio absoluto
El cambio con respecto al valor anterior
1 ene 1993 año
43.453
+43.453
0.0%
1 ene 1994 año
41.894
-1.56
-3.59%
1 ene 1995 año
46.799
+4.905
11.71%
1 ene 1997 año
39.1
-7.699
-16.45%
1 ene 2001 año
42.807
+3.707
9.48%
1 ene 2002 año
36.634
-6.173
-14.42%
1 ene 2003 año
36.288
-0.345
-0.94%
1 ene 2004 año
14.2
-22.088
-60.87%
1 ene 2005 año
13.791
-0.409
-2.88%
1 ene 2006 año
24.068
+10.277
74.52%
1 ene 2007 año
13.117
-10.951
-45.5%
1 ene 2008 año
12.587
-0.529
-4.04%
1 ene 2009 año
12.381
-0.206
-1.64%
1 ene 2010 año
12.102
-0.279
-2.26%
1 ene 2011 año
21.713
+9.612
79.43%
1 ene 2012 año
11.484
-10.229
-47.11%
Ranking de los países por los datos estadísticos actuales

Comentarios:

Enviar
PremiumAbout & FeedbackAcuerdoPrivacidad
logo
© 2022 Selected Technologies LLC – Morgan Hill, California