33
/es/
AIzaSyAYiBZKx7MnpbEhh9jyipgxe19OcubqV5w
May 1, 2025
35888
High income
HIC
false
2
1
Labor force with tertiary education, female (% of female labor force)
2008,2007,2003,2002,2001,2000,1999,1998
Download
Estadísticas Globales de la Biblioteca →High income →

Labor force with tertiary education, female (% of female labor force)

Estas estadísticas en otros países:

AlbaniaAlgeriaAntigua and BarbudaArgentinaArmeniaArubaAustraliaAustriaAzerbaijanBahamas, TheBahrainBarbadosBelarusBelgiumBelizeBermudaBoliviaBosnia and HerzegovinaBotswanaBrazilBritish Virgin IslandsBulgariaCanadaCayman IslandsCentral Europe and the BalticsChadChileColombiaCosta RicaCroatiaCubaCyprusCzech RepublicDenmarkDominicaDominican RepublicEarly-demographic dividendEcuadorEgypt, Arab Rep.El SalvadorEstoniaEthiopiaEuro areaEurope & Central AsiaEurope & Central Asia (excluding high income)Europe & Central Asia (IDA & IBRD countries)European UnionFinlandFranceGeorgiaGermanyGhanaGreeceGuatemalaGuyanaHigh incomeHondurasHong Kong SAR, ChinaHungaryIcelandIndiaIndonesiaIran, Islamic Rep.IrelandIsraelItalyJapanJordanKazakhstanKorea, Rep.KuwaitKyrgyz RepublicLatin America & Caribbean Latin America & Caribbean (excluding high income)Latin America & the Caribbean (IDA & IBRD countries)LatviaLebanonLithuaniaLuxembourgMacao SAR, ChinaMacedonia, FYRMadagascarMalaysiaMaltaMauritiusMexicoMoldovaMongoliaMontenegroMoroccoNamibiaNepalNetherlandsNew ZealandNicaraguaNigerNigeriaNorth AmericaNorwayOECD membersOmanPakistanPanamaParaguayPeruPhilippinesPolandPortugalPost-demographic dividendRomaniaRussian FederationRwandaSan MarinoSaudi ArabiaSerbiaSingaporeSlovak RepublicSloveniaSouth AfricaSouth AsiaSouth Asia (IDA & IBRD)SpainSri LankaSt. Kitts and NevisSt. LuciaSt. Vincent and the GrenadinesSwedenSwitzerlandSyrian Arab RepublicTajikistanThailandTimor-LesteTrinidad and TobagoTunisiaTurkeyUgandaUkraineUnited Arab EmiratesUnited KingdomUnited StatesUruguayVenezuela, RBWest Bank and GazaYemen, Rep.

línea de tiempo (timeline):

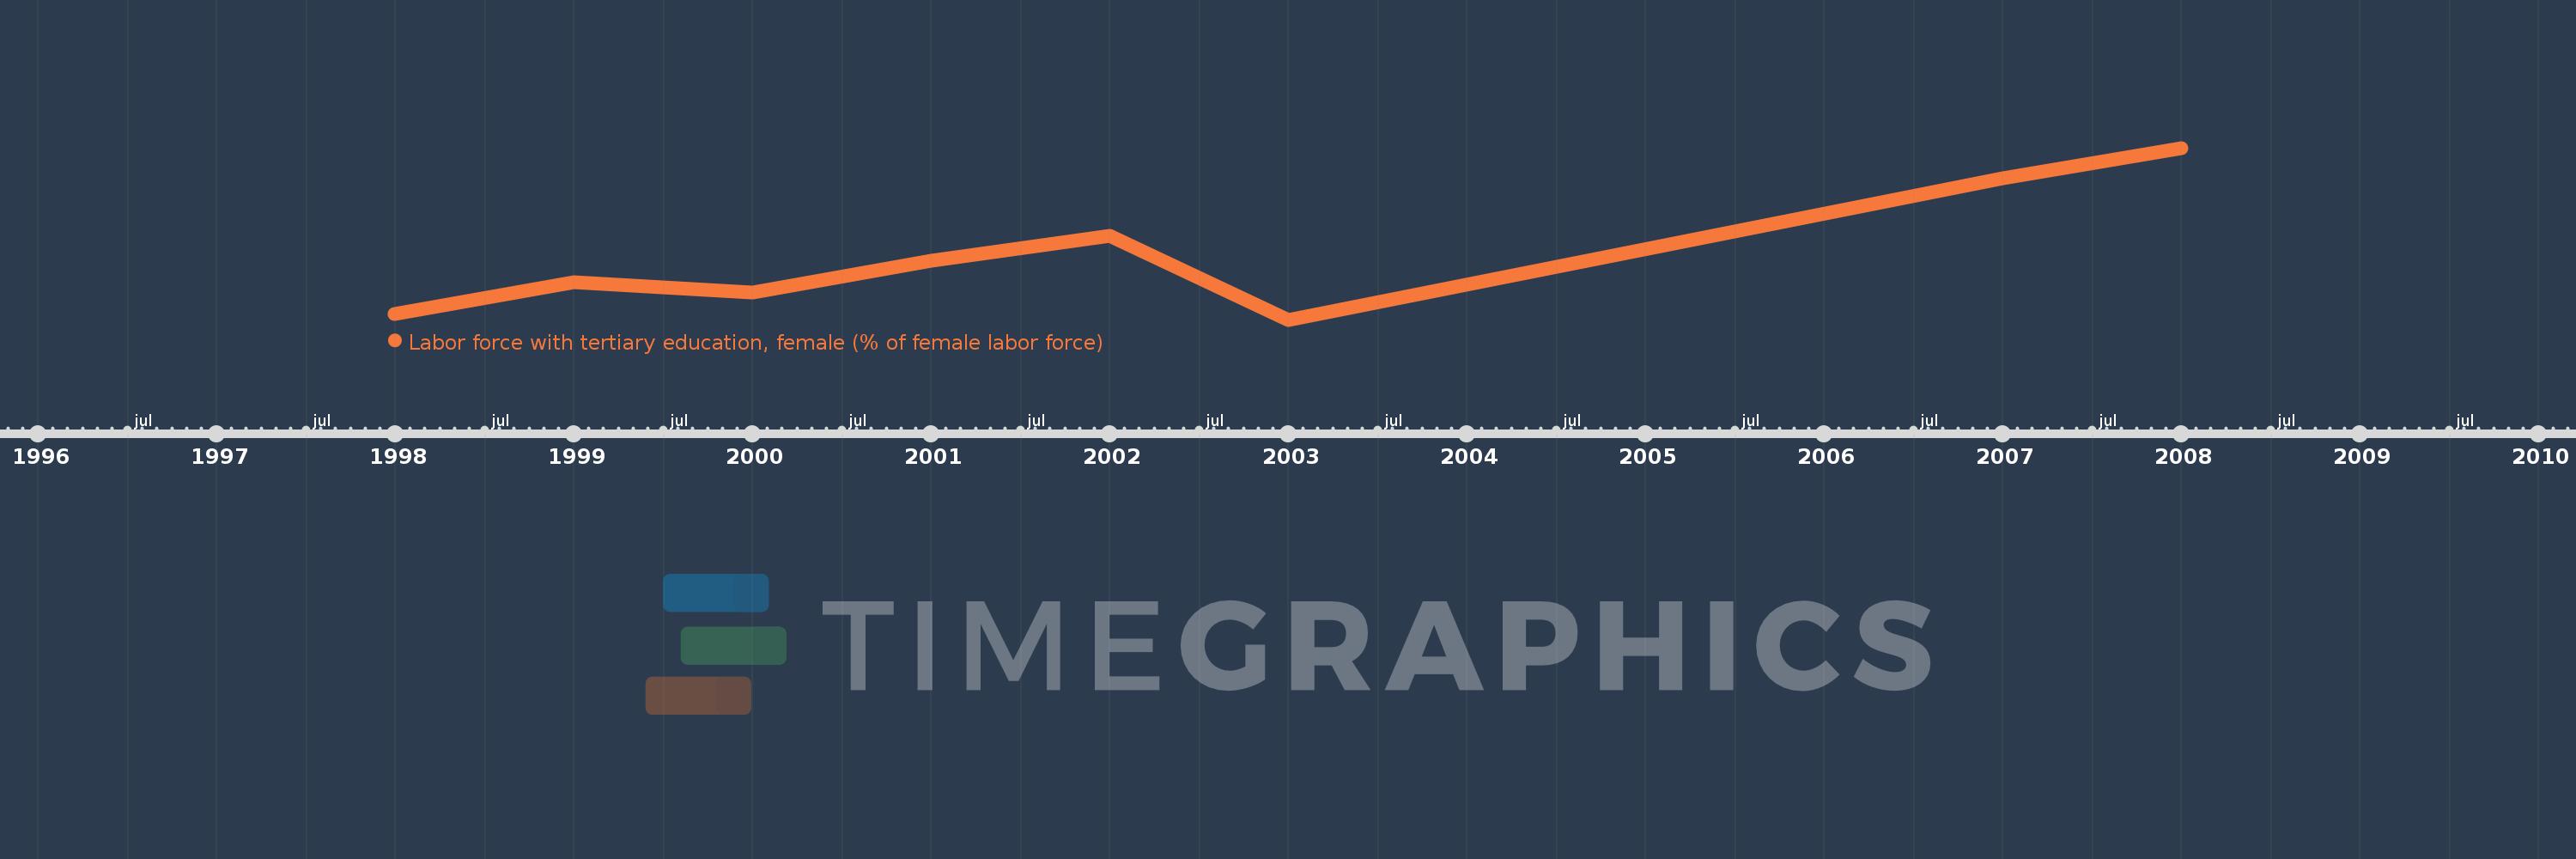
En esta escala de tiempo se presenta un gráfico de 1998 y 2008 de High income. Los datos de 1997 están ausentes. El número de observaciones reales por fecha: 8.

Fuente (nombre):

Indicadores del desarrollo mundial

Fuente (organización):

International Labour Organization, Key Indicators of the Labour Market database.

Categorías:

Education, Social Protection & Labor, Gender

Se ha actualizado:

23 abr 2017 año

Los indicadores de los cambios de valor en los últimos años

En promedio:
28.92
Mínimo:
27.079
1 ene 2003 año
Máximo:
31.872
1 ene 2008 año
A la fecha de observación
Valor
Cambio absoluto
El cambio con respecto al valor anterior
1 ene 1998 año
27.247
+27.247
0.0%
1 ene 1999 año
28.137
+0.891
3.27%
1 ene 2000 año
27.834
-0.304
-1.08%
1 ene 2001 año
28.726
+0.892
3.21%
1 ene 2002 año
29.43
+0.704
2.45%
1 ene 2003 año
27.079
-2.351
-7.99%
1 ene 2007 año
31.036
+3.957
14.61%
1 ene 2008 año
31.872
+0.836
2.69%

Ranking de los países por los datos estadísticos actuales