33
/es/
AIzaSyAYiBZKx7MnpbEhh9jyipgxe19OcubqV5w
August 1, 2025
35887
High income
HIC
false
2
1
Labor force with tertiary education (% of total)
2015,2014,2013,2012,2011,2010,2008,2007,2003,2002,2001,2000,1999,1998
Download
Estadísticas Globales de la Biblioteca →High income →

Labor force with tertiary education (% of total)

Estas estadísticas en otros países:

AlbaniaAlgeriaAntigua and BarbudaArgentinaArmeniaArubaAustraliaAustriaAzerbaijanBahamas, TheBahrainBarbadosBelarusBelgiumBelizeBermudaBoliviaBosnia and HerzegovinaBotswanaBrazilBritish Virgin IslandsBulgariaCambodiaCanadaCayman IslandsCentral Europe and the BalticsChadChileColombiaCosta RicaCroatiaCubaCyprusCzech RepublicDenmarkDominicaDominican RepublicEarly-demographic dividendEcuadorEgypt, Arab Rep.El SalvadorEstoniaEthiopiaEuro areaEurope & Central AsiaEurope & Central Asia (excluding high income)Europe & Central Asia (IDA & IBRD countries)European UnionFinlandFranceFrench PolynesiaGeorgiaGermanyGhanaGreeceGuatemalaGuyanaHigh incomeHondurasHong Kong SAR, ChinaHungaryIcelandIndiaIndonesiaIran, Islamic Rep.IrelandIsraelItalyJapanJordanKazakhstanKorea, Rep.KosovoKuwaitKyrgyz RepublicLatin America & Caribbean Latin America & Caribbean (excluding high income)Latin America & the Caribbean (IDA & IBRD countries)LatviaLebanonLithuaniaLuxembourgMacao SAR, ChinaMacedonia, FYRMadagascarMalaysiaMaltaMauritiusMexicoMoldovaMongoliaMontenegroMoroccoNamibiaNepalNetherlandsNew CaledoniaNew ZealandNicaraguaNigerNigeriaNorth AmericaNorwayOECD membersOmanPakistanPanamaParaguayPeruPhilippinesPolandPortugalPost-demographic dividendRomaniaRussian FederationRwandaSan MarinoSaudi ArabiaSerbiaSingaporeSlovak RepublicSloveniaSouth AfricaSouth AsiaSouth Asia (IDA & IBRD)SpainSri LankaSt. Kitts and NevisSt. LuciaSt. Vincent and the GrenadinesSwedenSwitzerlandSyrian Arab RepublicTajikistanThailandTimor-LesteTrinidad and TobagoTunisiaTurkeyUgandaUkraineUnited Arab EmiratesUnited KingdomUnited StatesUruguayVenezuela, RBWest Bank and GazaYemen, Rep.

línea de tiempo (timeline):

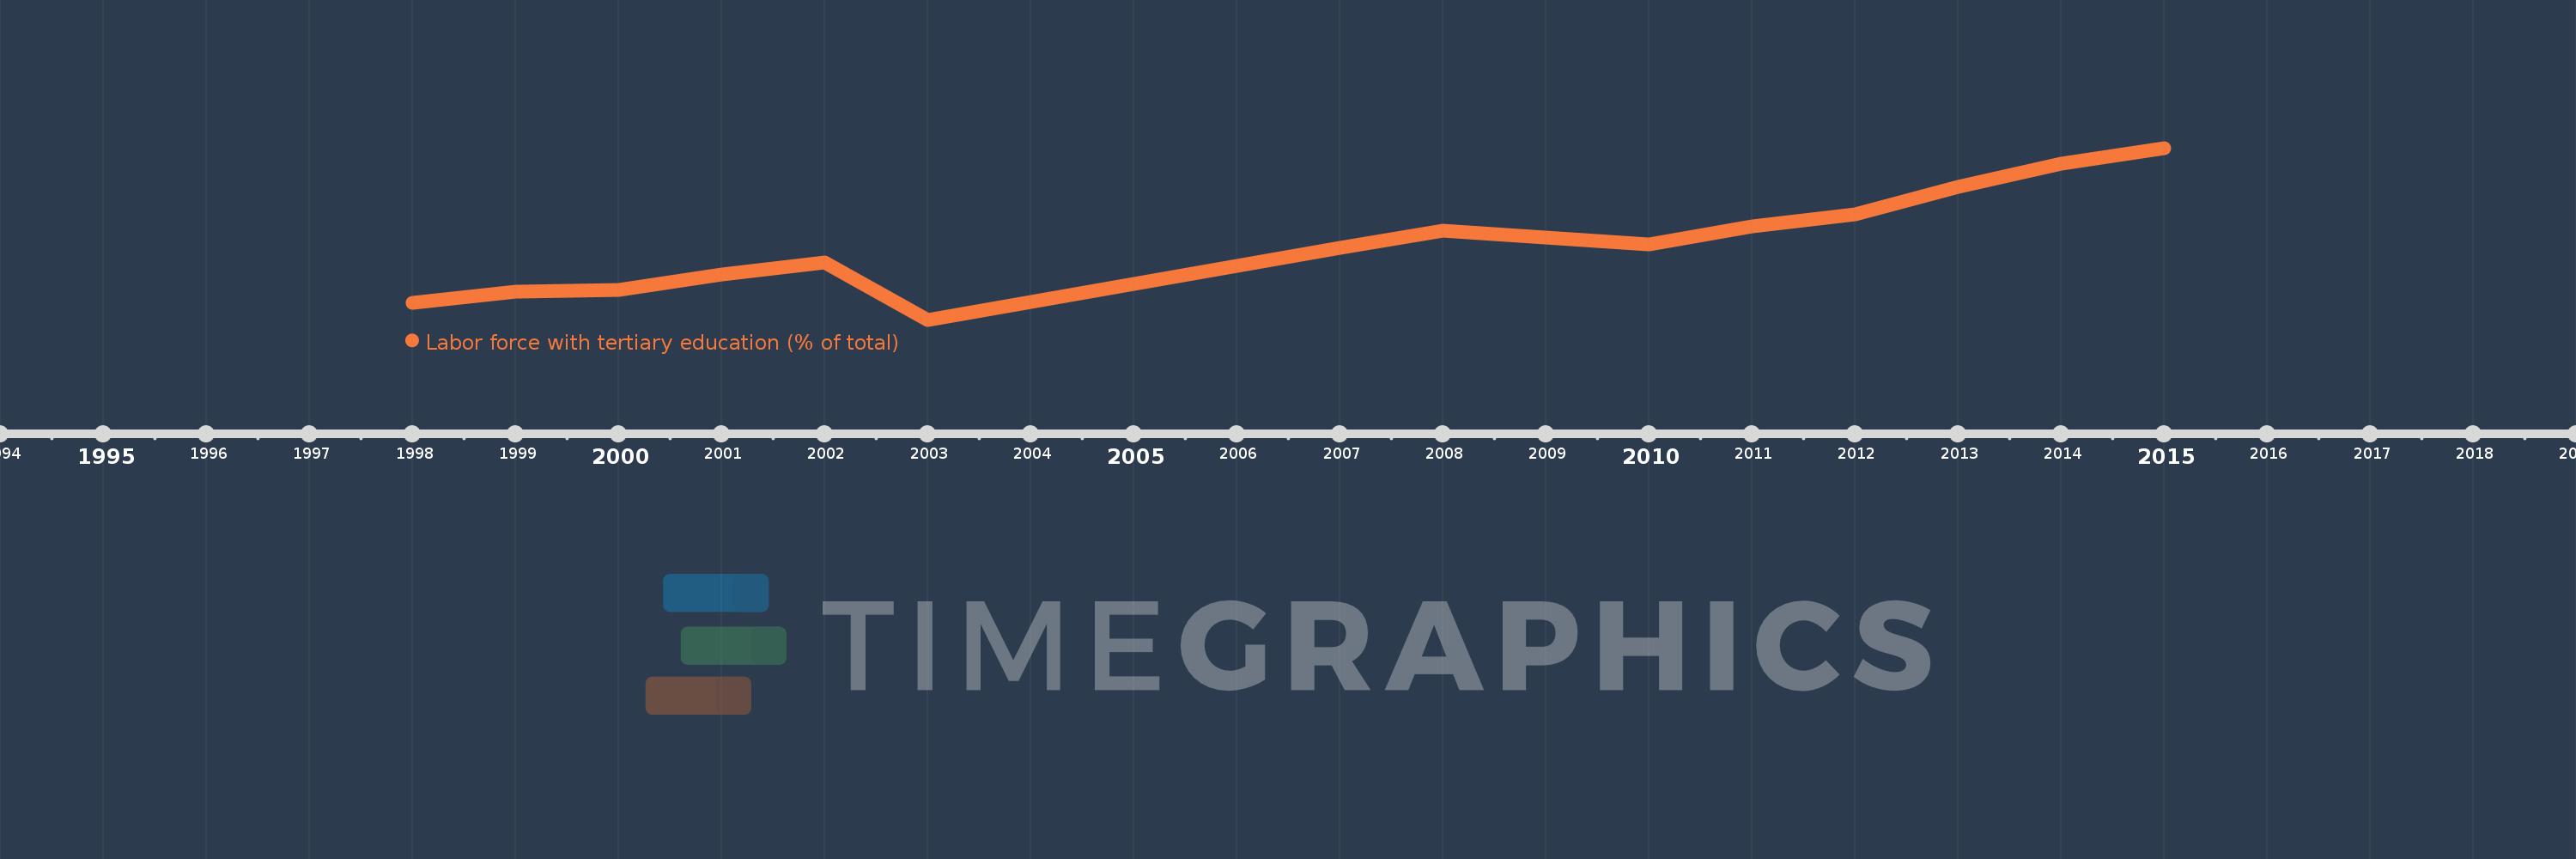
En esta escala de tiempo se presenta un gráfico de 1998 y 2015 de High income. Los datos de 1997 están ausentes. El número de observaciones reales por fecha: 14.

Fuente (nombre):

Indicadores del desarrollo mundial

Fuente (organización):

International Labour Organization, Key Indicators of the Labour Market database.

Categorías:

Education, Social Protection & Labor

Se ha actualizado:

23 abr 2017 año

Los indicadores de los cambios de valor en los últimos años

En promedio:
29.494
Mínimo:
26.205
1 ene 2003 año
Máximo:
33.579
1 ene 2015 año
A la fecha de observación
Valor
Cambio absoluto
El cambio con respecto al valor anterior
1 ene 1998 año
26.944
+26.944
0.0%
1 ene 1999 año
27.397
+0.454
1.68%
1 ene 2000 año
27.472
+0.074
0.27%
1 ene 2001 año
28.147
+0.675
2.46%
1 ene 2002 año
28.664
+0.517
1.84%
1 ene 2003 año
26.205
-2.459
-8.58%
1 ene 2007 año
29.275
+3.07
11.72%
1 ene 2008 año
30.02
+0.746
2.55%
1 ene 2010 año
29.437
-0.583
-1.94%
1 ene 2011 año
30.23
+0.793
2.69%
1 ene 2012 año
30.747
+0.517
1.71%
1 ene 2013 año
31.913
+1.166
3.79%
1 ene 2014 año
32.894
+0.981
3.07%
1 ene 2015 año
33.579
+0.686
2.09%

Ranking de los países por los datos estadísticos actuales