33
/es/
AIzaSyAYiBZKx7MnpbEhh9jyipgxe19OcubqV5w
August 1, 2025
35559
High income
HIC
false
2
1
Binding coverage, all products (%)
2013,2011,2010,2009,2008,2007,2006,2005,2004,2003,2002,2001,2000,1999,1998,1997
Download
Estadísticas Globales de la Biblioteca →High income →

Binding coverage, all products (%)

Estas estadísticas en otros países:

AlbaniaAngolaAntigua and BarbudaArgentinaArmeniaAustraliaAustriaBahrainBangladeshBarbadosBelgiumBelizeBeninBoliviaBotswanaBrazilBrunei DarussalamBulgariaBurkina FasoBurundiCabo VerdeCambodiaCameroonCanadaCentral African RepublicChadChileChinaColombiaCongo, Dem. Rep.Congo, Rep.Costa RicaCote d'IvoireCroatiaCubaCyprusCzech RepublicDenmarkDjiboutiDominicaDominican RepublicEast Asia & Pacific (excluding high income)EcuadorEgypt, Arab Rep.El SalvadorEstoniaEurope & Central Asia (excluding high income)European UnionFijiFinlandFranceGabonGambia, TheGeorgiaGermanyGhanaGreeceGrenadaGuatemalaGuineaGuinea-BissauGuyanaHaitiHigh incomeHondurasHong Kong SAR, ChinaHungaryIcelandIndiaIndonesiaIrelandIsraelItalyJamaicaJapanJordanKenyaKorea, Rep.KuwaitKyrgyz RepublicLatin America & Caribbean (excluding high income)LatviaLesothoLithuaniaLow & middle incomeLow incomeLower middle incomeLuxembourgMacao SAR, ChinaMacedonia, FYRMadagascarMalawiMalaysiaMaldivesMaliMaltaMauritaniaMauritiusMexicoMiddle East & North Africa (excluding high income)Middle incomeMoldovaMongoliaMoroccoMozambiqueMyanmarNamibiaNepalNetherlandsNew ZealandNicaraguaNigerNigeriaNorwayOECD membersOmanPakistanPanamaPapua New GuineaParaguayPeruPhilippinesPolandPortugalQatarRomaniaRwandaSaudi ArabiaSenegalSierra LeoneSingaporeSlovak RepublicSloveniaSolomon IslandsSouth AfricaSouth AsiaSpainSri LankaSt. Kitts and NevisSt. LuciaSt. Vincent and the GrenadinesSub-Saharan Africa (excluding high income)SurinameSwazilandSwedenSwitzerlandTanzaniaThailandTogoTongaTrinidad and TobagoTunisiaTurkeyUgandaUkraineUnited Arab EmiratesUnited KingdomUnited StatesUpper middle incomeUruguayVenezuela, RBVietnamWorldZambiaZimbabwe

línea de tiempo (timeline):

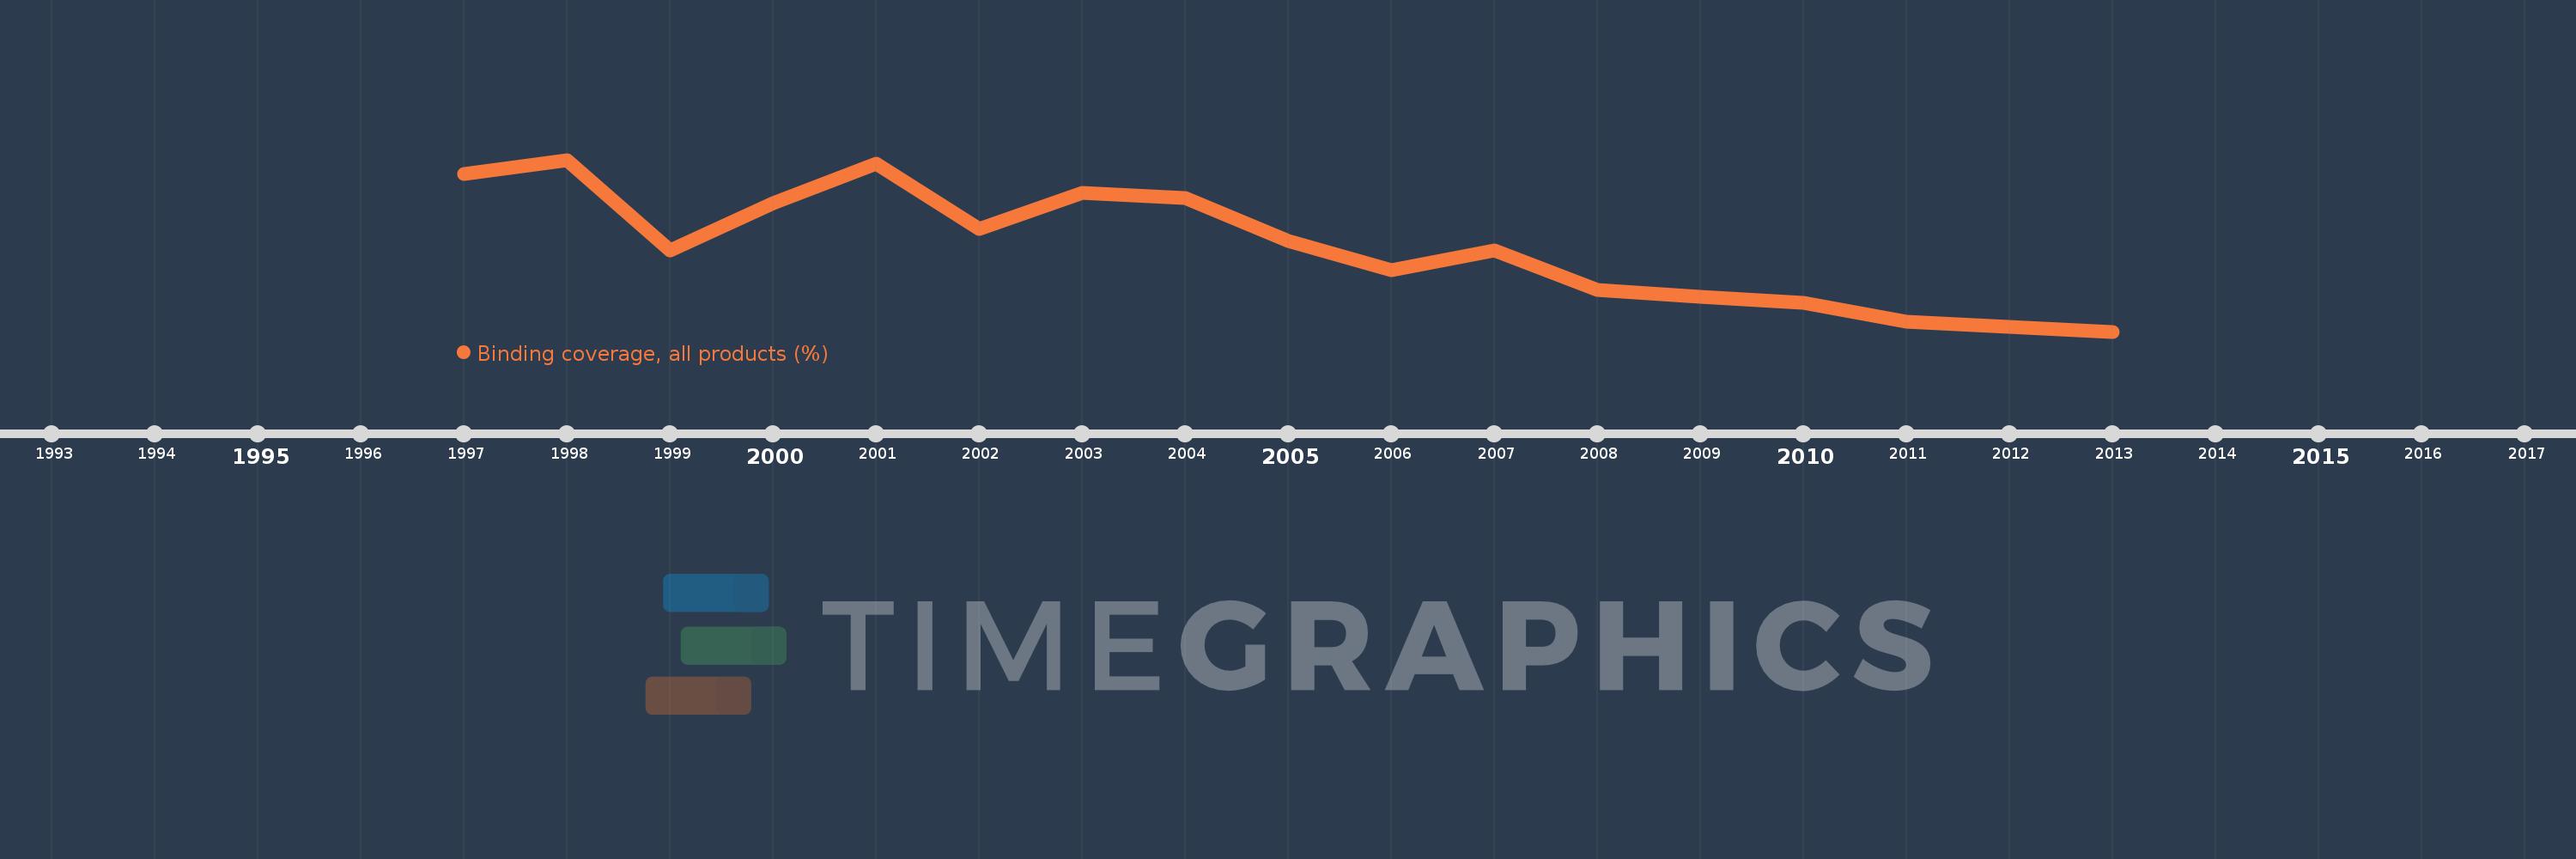
En esta escala de tiempo se presenta un gráfico de 1997 y 2013 de High income. Los datos de 1996 están ausentes. El número de observaciones reales por fecha: 16.

Fuente (nombre):

Indicadores del desarrollo mundial

Fuente (organización):

World Bank staff estimates using the World Integrated Trade Solution system, based on data from World Trade Organization.

Categorías:

Private Sector, Trade

Se ha actualizado:

23 abr 2017 año

Los indicadores de los cambios de valor en los últimos años

En promedio:
94.161
Mínimo:
88.43
1 ene 2013 año
Máximo:
99.43
1 ene 1998 año
A la fecha de observación
Valor
Cambio absoluto
El cambio con respecto al valor anterior
1 ene 1997 año
98.55
+98.55
0.0%
1 ene 1998 año
99.43
+0.88
0.89%
1 ene 1999 año
93.61
-5.82
-5.85%
1 ene 2000 año
96.68
+3.07
3.28%
1 ene 2001 año
99.18
+2.5
2.59%
1 ene 2002 año
95.01
-4.17
-4.2%
1 ene 2003 año
97.31
+2.3
2.42%
1 ene 2004 año
97.01
-0.3
-0.31%
1 ene 2005 año
94.24
-2.77
-2.86%
1 ene 2006 año
92.37
-1.87
-1.98%
1 ene 2007 año
93.62
+1.25
1.35%
1 ene 2008 año
91.12
-2.5
-2.67%
1 ene 2009 año
90.68
-0.44
-0.48%
1 ene 2010 año
90.27
-0.41
-0.45%
1 ene 2011 año
89.06
-1.21
-1.34%
1 ene 2013 año
88.43
-0.63
-0.71%

Ranking de los países por los datos estadísticos actuales