33
/es/
AIzaSyAYiBZKx7MnpbEhh9jyipgxe19OcubqV5w
August 1, 2025
34629
Fragile and conflict affected situations
FCS
false
2
1
Source data assessment of statistical capacity (scale 0 - 100)
2017,2016,2015,2014,2013,2012,2011,2010,2009,2008,2007,2006,2005
Download
Estadísticas Globales de la Biblioteca →Fragile and conflict affected situations →

Source data assessment of statistical capacity (scale 0 - 100)

Estas estadísticas en otros países:

AfghanistanAlbaniaAlgeriaAngolaAntigua and BarbudaArgentinaArmeniaAzerbaijanBangladeshBelarusBelizeBeninBhutanBoliviaBosnia and HerzegovinaBotswanaBrazilBulgariaBurkina FasoBurundiCabo VerdeCambodiaCameroonCaribbean small statesCentral African RepublicChadChileChinaColombiaComorosCongo, Dem. Rep.Congo, Rep.Costa RicaCote d'IvoireCroatiaDjiboutiDominicaDominican RepublicEarly-demographic dividendEast Asia & Pacific (excluding high income)East Asia & Pacific (IDA & IBRD countries)EcuadorEgypt, Arab Rep.El SalvadorEquatorial GuineaEritreaEthiopiaEurope & Central Asia (excluding high income)Europe & Central Asia (IDA & IBRD countries)FijiFragile and conflict affected situationsGabonGambia, TheGeorgiaGhanaGrenadaGuatemalaGuineaGuinea-BissauGuyanaHaitiHeavily indebted poor countries (HIPC)HondurasHungaryIBRD onlyIDA & IBRD totalIDA blendIDA onlyIDA totalIndiaIndonesiaIran, Islamic Rep.IraqJamaicaJordanKazakhstanKenyaKiribatiKosovoKyrgyz RepublicLao PDRLate-demographic dividendLatin America & Caribbean (excluding high income)Latin America & the Caribbean (IDA & IBRD countries)Least developed countries: UN classificationLebanonLesothoLiberiaLibyaLow & middle incomeLow incomeLower middle incomeMacedonia, FYRMadagascarMalawiMalaysiaMaldivesMaliMarshall IslandsMauritaniaMauritiusMexicoMicronesia, Fed. Sts.Middle East & North Africa (excluding high income)Middle East & North Africa (IDA & IBRD countries)Middle incomeMoldovaMongoliaMontenegroMoroccoMozambiqueMyanmarNamibiaNepalNicaraguaNigerNigeriaOther small statesPakistanPalauPanamaPapua New GuineaParaguayPeruPhilippinesPolandPre-demographic dividendRomaniaRussian FederationRwandaSamoaSao Tome and PrincipeSenegalSerbiaSeychellesSierra LeoneSlovak RepublicSmall statesSolomon IslandsSomaliaSouth AfricaSouth AsiaSouth Asia (IDA & IBRD)South SudanSri LankaSt. Kitts and NevisSt. LuciaSt. Vincent and the GrenadinesSub-Saharan Africa (excluding high income)Sub-Saharan Africa (IDA & IBRD countries)SudanSurinameSwazilandSyrian Arab RepublicTajikistanTanzaniaThailandTimor-LesteTogoTongaTrinidad and TobagoTunisiaTurkeyTurkmenistanTuvaluUgandaUkraineUpper middle incomeUruguayUzbekistanVanuatuVenezuela, RBVietnamWest Bank and GazaYemen, Rep.ZambiaZimbabwe

línea de tiempo (timeline):

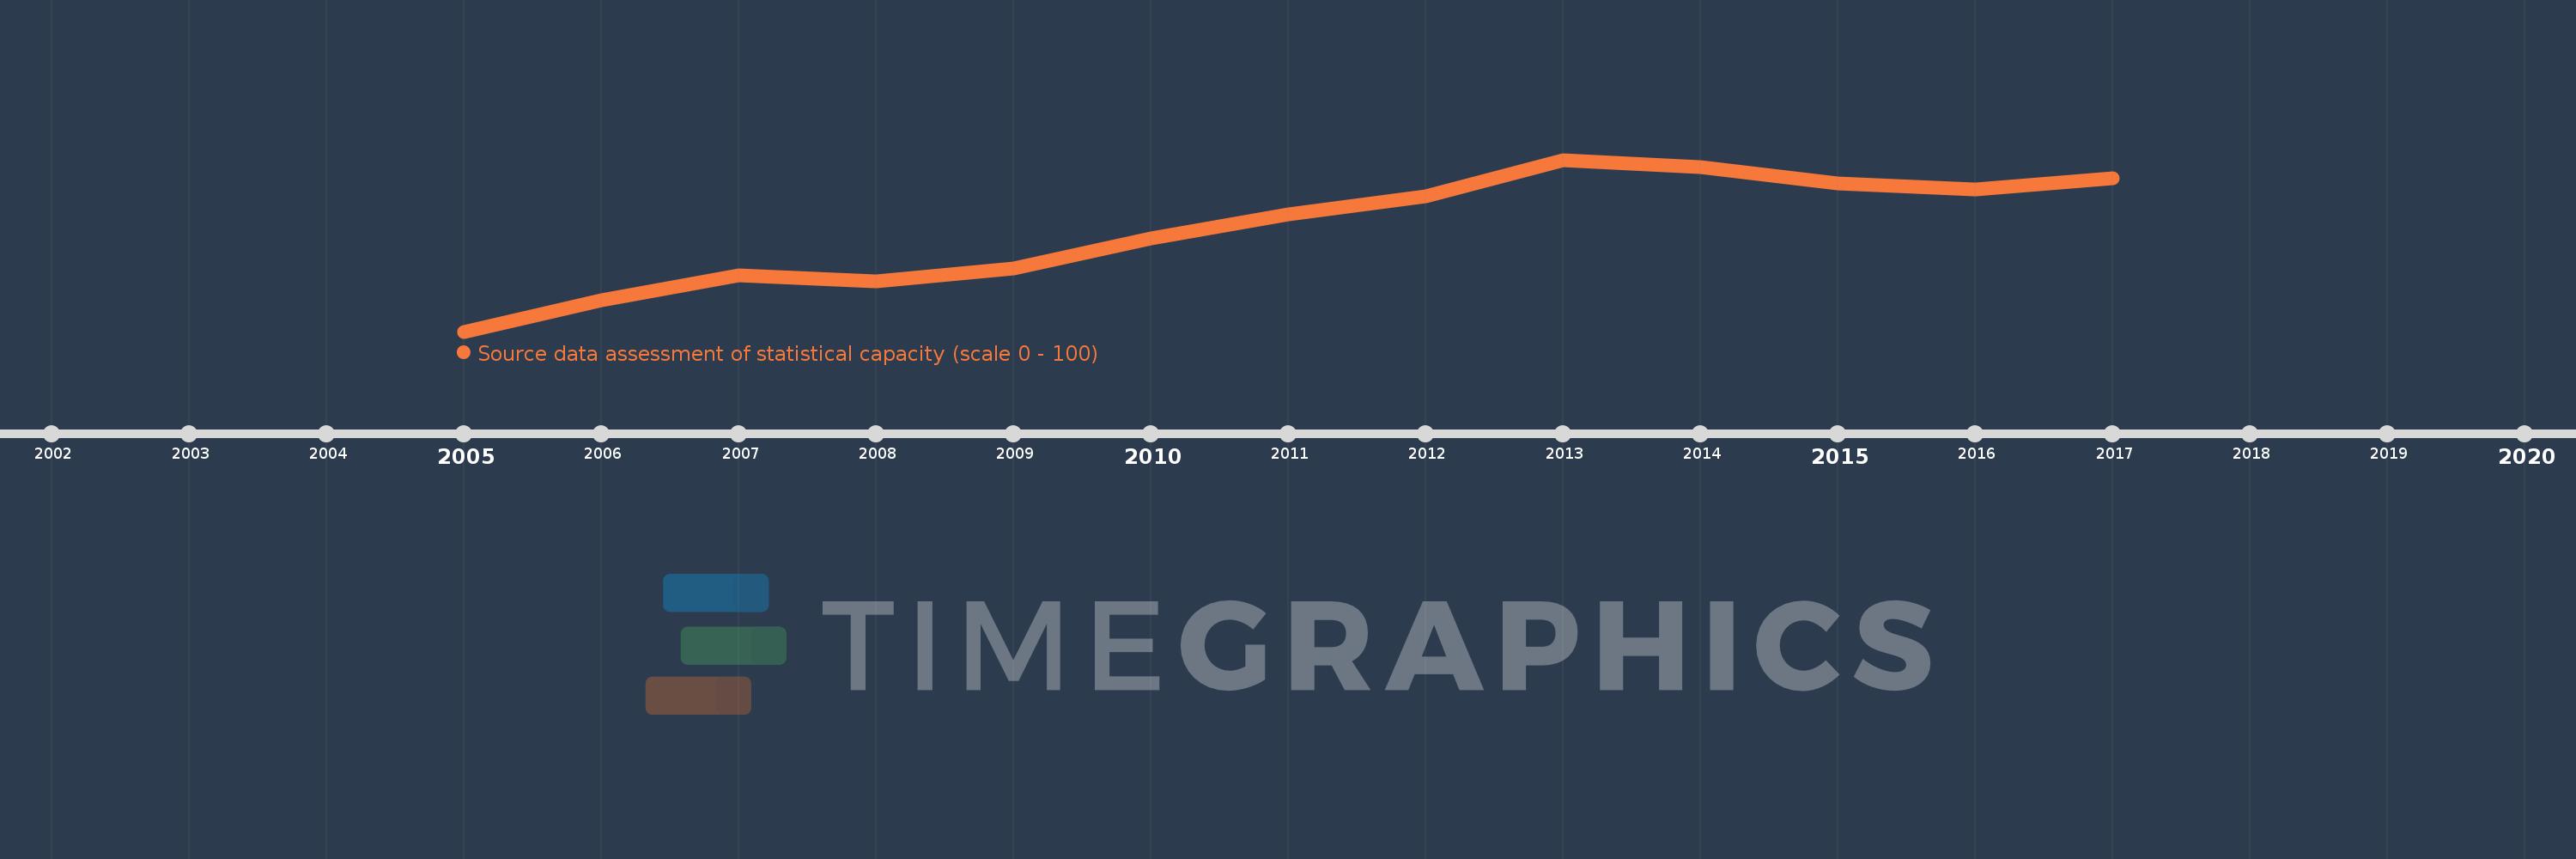
En esta escala de tiempo se presenta un gráfico de 2005 y 2017 de Fragile and conflict affected situations. Los datos de 2004 están ausentes. El número de observaciones reales por fecha: 13.

Fuente (nombre):

Indicadores del desarrollo mundial

Fuente (organización):

World Bank

Categorías:

Public Sector

Se ha actualizado:

23 abr 2017 año

Los indicadores de los cambios de valor en los últimos años

En promedio:
41.715
Mínimo:
35.2
1 ene 2005 año
Máximo:
46.154
1 ene 2013 año
A la fecha de observación
Valor
Cambio absoluto
El cambio con respecto al valor anterior
1 ene 2005 año
35.2
+35.2
0.0%
1 ene 2006 año
37.2
+2.0
5.68%
1 ene 2007 año
38.8
+1.6
4.3%
1 ene 2008 año
38.4
-0.4
-1.03%
1 ene 2009 año
39.2
+0.8
2.08%
1 ene 2010 año
41.154
+1.954
4.98%
1 ene 2011 año
42.692
+1.538
3.74%
1 ene 2012 año
43.846
+1.154
2.7%
1 ene 2013 año
46.154
+2.308
5.26%
1 ene 2014 año
45.714
-0.44
-0.95%
1 ene 2015 año
44.643
-1.071
-2.34%
1 ene 2016 año
44.286
-0.357
-0.8%
1 ene 2017 año
45.0
+0.714
1.61%

Ranking de los países por los datos estadísticos actuales