33
/es/
AIzaSyAYiBZKx7MnpbEhh9jyipgxe19OcubqV5w
August 1, 2025
32757
Europe & Central Asia (IDA & IBRD countries)
TEC
false
2
1
Labor force with secondary education (% of total)
2014,2013,2012,2011,2010,2009,2008,2007,2006,2005,2004,2003
Download
Estadísticas Globales de la Biblioteca →Europe & Central Asia (IDA & IBRD countries) →

Labor force with secondary education (% of total)

Estas estadísticas en otros países:

AlbaniaAlgeriaAntigua and BarbudaArgentinaArmeniaArubaAustraliaAustriaAzerbaijanBahamas, TheBahrainBarbadosBelarusBelgiumBelizeBermudaBoliviaBosnia and HerzegovinaBotswanaBrazilBritish Virgin IslandsBulgariaCambodiaCanadaCayman IslandsCentral Europe and the BalticsChadChileColombiaCosta RicaCroatiaCubaCyprusCzech RepublicDenmarkDominicaDominican RepublicEarly-demographic dividendEcuadorEgypt, Arab Rep.El SalvadorEstoniaEthiopiaEuro areaEurope & Central AsiaEurope & Central Asia (excluding high income)Europe & Central Asia (IDA & IBRD countries)European UnionFinlandFranceFrench PolynesiaGeorgiaGermanyGhanaGreeceGuatemalaGuyanaHigh incomeHondurasHong Kong SAR, ChinaHungaryIcelandIndiaIndonesiaIran, Islamic Rep.IrelandIsraelItalyJapanJordanKazakhstanKorea, Rep.KosovoKuwaitKyrgyz RepublicLatin America & Caribbean Latin America & Caribbean (excluding high income)Latin America & the Caribbean (IDA & IBRD countries)LatviaLebanonLithuaniaLuxembourgMacao SAR, ChinaMacedonia, FYRMadagascarMalaysiaMaltaMauritiusMexicoMoldovaMongoliaMontenegroMoroccoNamibiaNepalNetherlandsNew CaledoniaNew ZealandNicaraguaNigerNigeriaNorth AmericaNorwayOECD membersOmanPakistanPanamaParaguayPeruPhilippinesPolandPortugalPost-demographic dividendRomaniaRussian FederationRwandaSan MarinoSaudi ArabiaSerbiaSingaporeSlovak RepublicSloveniaSouth AfricaSouth AsiaSouth Asia (IDA & IBRD)SpainSri LankaSt. Kitts and NevisSt. LuciaSt. Vincent and the GrenadinesSwedenSwitzerlandSyrian Arab RepublicTajikistanThailandTimor-LesteTrinidad and TobagoTunisiaTurkeyUgandaUkraineUnited Arab EmiratesUnited KingdomUnited StatesUruguayVenezuela, RBWest Bank and GazaYemen, Rep.

línea de tiempo (timeline):

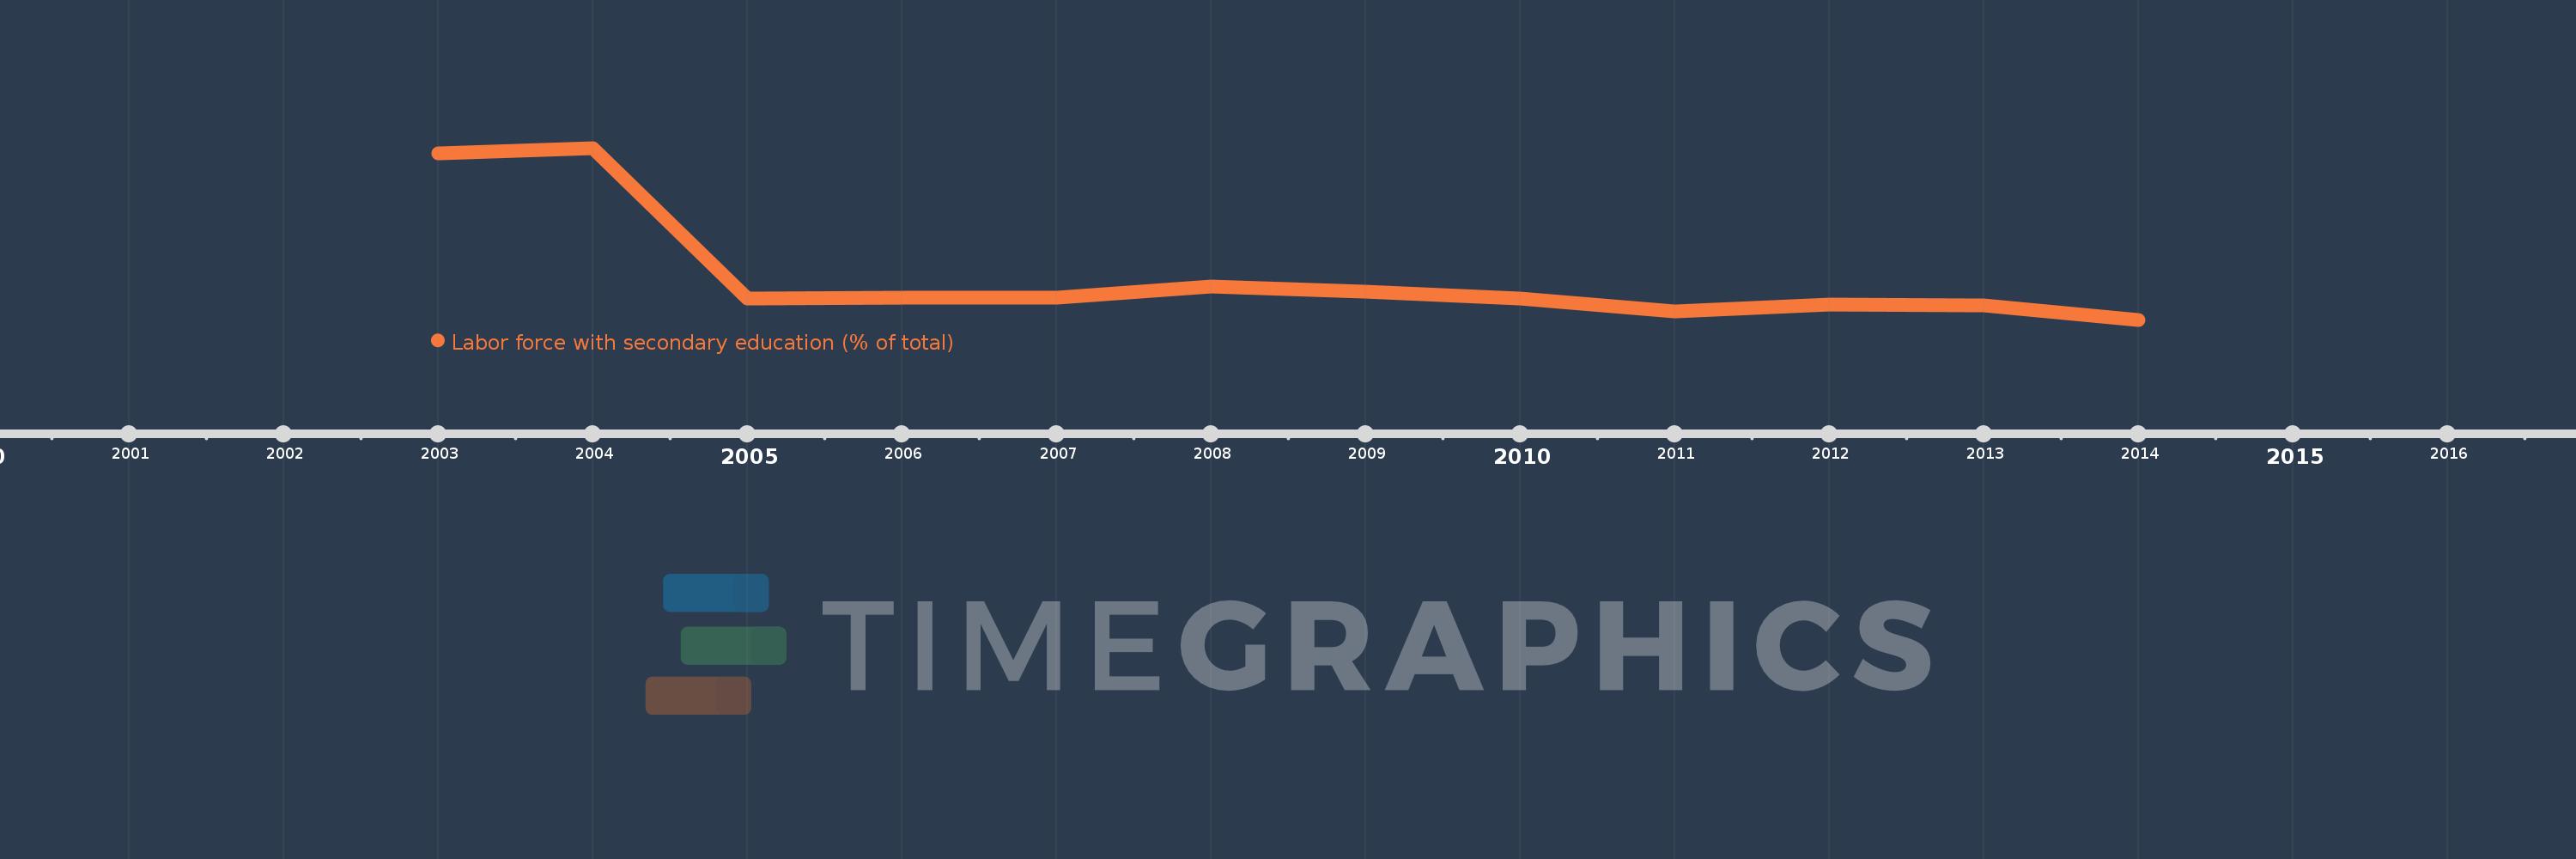
En esta escala de tiempo se presenta un gráfico de 2003 y 2014 de Europe & Central Asia (IDA & IBRD countries). Los datos de 2002 están ausentes. El número de observaciones reales por fecha: 12.

Fuente (nombre):

Indicadores del desarrollo mundial

Fuente (organización):

International Labour Organization, Key Indicators of the Labour Market database.

Categorías:

Education, Social Protection & Labor

Se ha actualizado:

23 abr 2017 año

Los indicadores de los cambios de valor en los últimos años

En promedio:
46.435
Mínimo:
42.676
1 ene 2014 año
Máximo:
57.481
1 ene 2004 año
A la fecha de observación
Valor
Cambio absoluto
El cambio con respecto al valor anterior
1 ene 2003 año
57.017
+57.017
0.0%
1 ene 2004 año
57.481
+0.464
0.81%
1 ene 2005 año
44.487
-12.994
-22.61%
1 ene 2006 año
44.574
+0.087
0.2%
1 ene 2007 año
44.569
-0.006
-0.01%
1 ene 2008 año
45.542
+0.973
2.18%
1 ene 2009 año
45.062
-0.48
-1.05%
1 ene 2010 año
44.536
-0.526
-1.17%
1 ene 2011 año
43.409
-1.127
-2.53%
1 ene 2012 año
43.953
+0.545
1.25%
1 ene 2013 año
43.908
-0.045
-0.1%
1 ene 2014 año
42.676
-1.232
-2.81%

Ranking de los países por los datos estadísticos actuales