33
/es/
AIzaSyB4mHJ5NPEv-XzF7P6NDYXjlkCWaeKw5bc
November 30, 2025
32320
Europe & Central Asia (excluding high income)
ECA
false
2
1
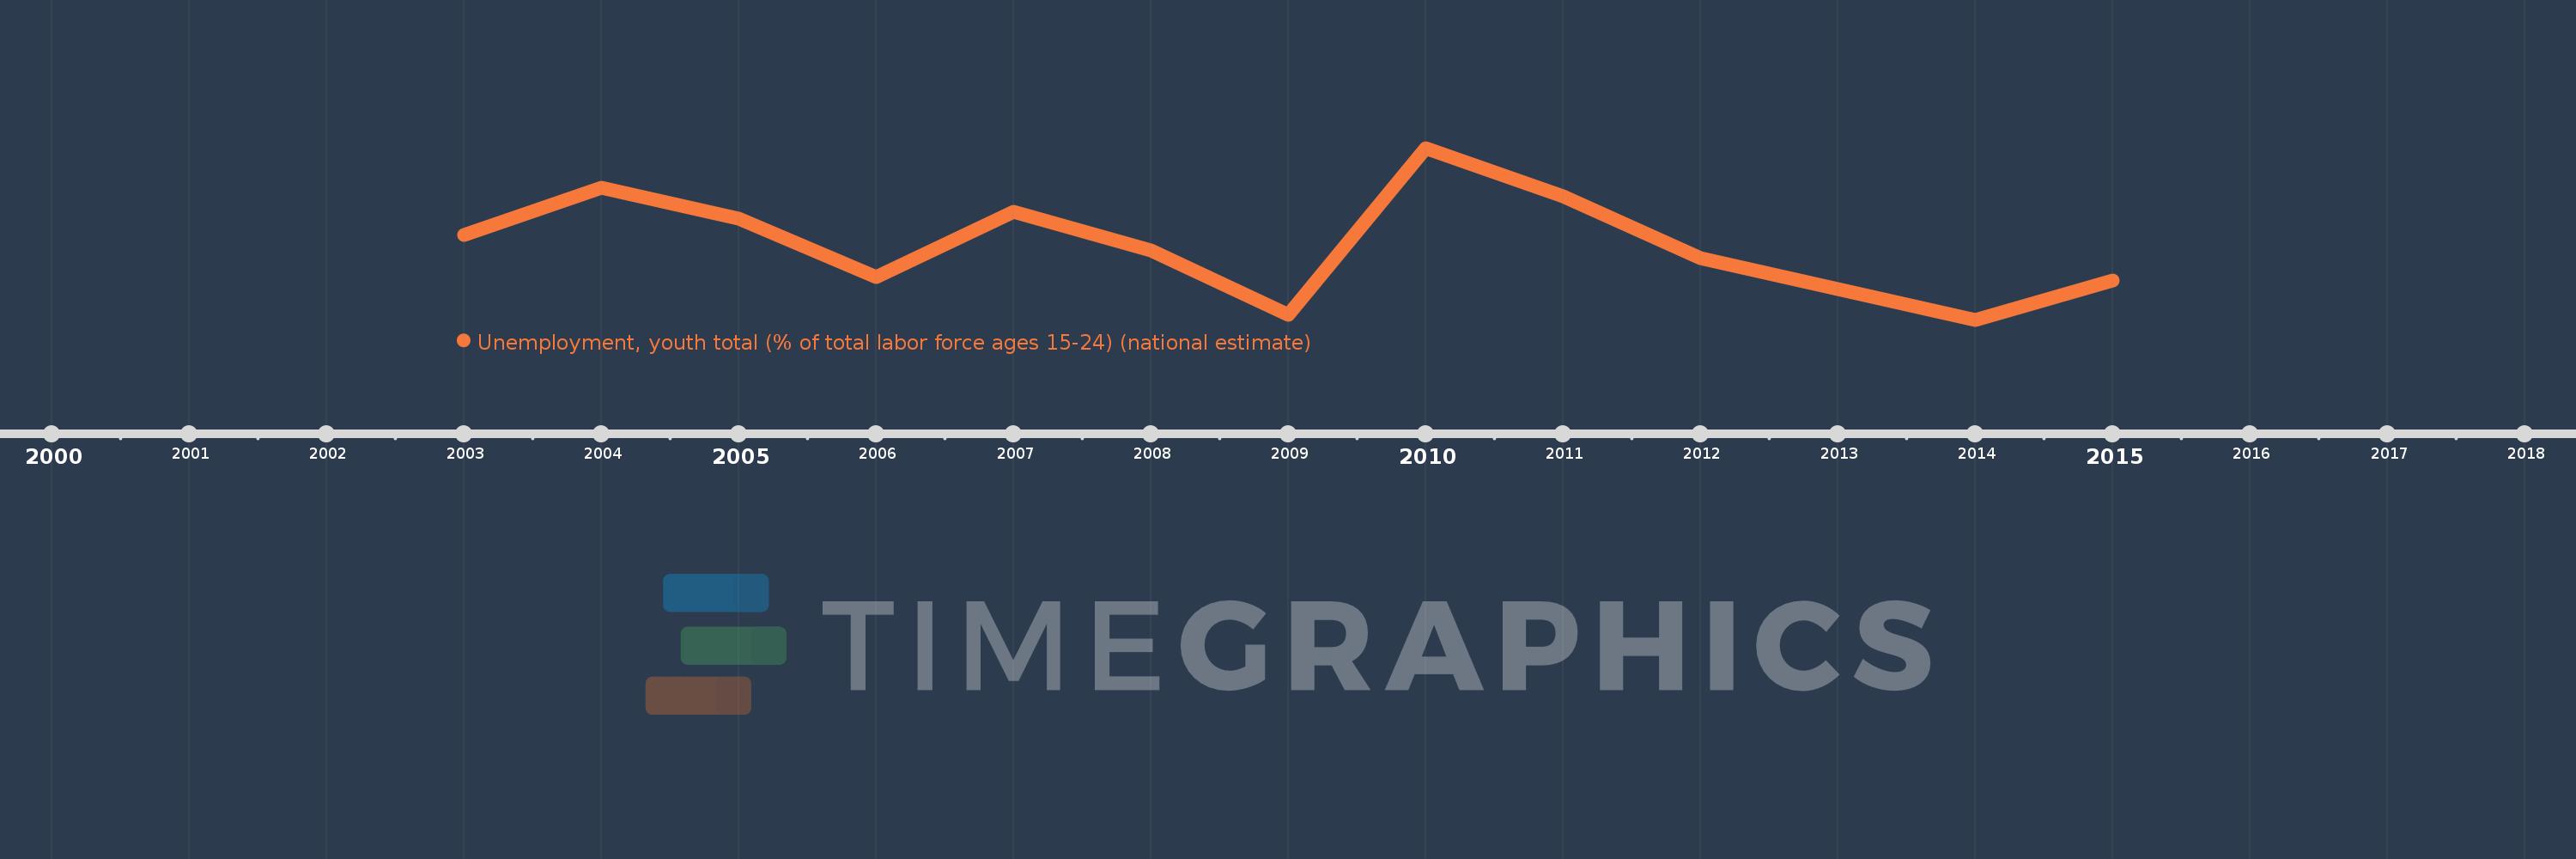
Unemployment, youth total (% of total labor force ages 15-24) (national estimate)
2015,2014,2013,2012,2011,2010,2009,2008,2007,2006,2005,2004,2003