33
/es/
AIzaSyAYiBZKx7MnpbEhh9jyipgxe19OcubqV5w
August 1, 2025
31756
Europe & Central Asia (excluding high income)
ECA
false
2
1
Labor force with primary education, male (% of male labor force)
2014,2013,2012,2011,2010,2008,2005,2003
Download
Estadísticas Globales de la Biblioteca →Europe & Central Asia (excluding high income) →

Labor force with primary education, male (% of male labor force)

Estas estadísticas en otros países:

AlbaniaAlgeriaAntigua and BarbudaArgentinaArmeniaArubaAustraliaAustriaAzerbaijanBahamas, TheBahrainBarbadosBelarusBelgiumBelizeBermudaBoliviaBosnia and HerzegovinaBotswanaBrazilBritish Virgin IslandsBulgariaCanadaCayman IslandsCentral Europe and the BalticsChadChileColombiaCosta RicaCroatiaCubaCyprusCzech RepublicDenmarkDominicaDominican RepublicEcuadorEgypt, Arab Rep.El SalvadorEstoniaEthiopiaEuro areaEurope & Central AsiaEurope & Central Asia (excluding high income)Europe & Central Asia (IDA & IBRD countries)European UnionFinlandFranceGeorgiaGermanyGhanaGreeceGuatemalaGuyanaHigh incomeHondurasHong Kong SAR, ChinaHungaryIcelandIndiaIndonesiaIran, Islamic Rep.IrelandIsraelItalyJapanJordanKazakhstanKorea, Rep.KuwaitKyrgyz RepublicLatin America & Caribbean Latin America & Caribbean (excluding high income)Latin America & the Caribbean (IDA & IBRD countries)LatviaLebanonLithuaniaLuxembourgMacao SAR, ChinaMacedonia, FYRMadagascarMalaysiaMaltaMauritiusMexicoMoldovaMongoliaMontenegroMoroccoNamibiaNepalNetherlandsNew ZealandNicaraguaNigerNigeriaNorth AmericaNorwayOECD membersOmanPakistanPanamaParaguayPeruPhilippinesPolandPortugalPost-demographic dividendRomaniaRussian FederationRwandaSan MarinoSaudi ArabiaSerbiaSingaporeSlovak RepublicSloveniaSouth AfricaSouth AsiaSouth Asia (IDA & IBRD)SpainSri LankaSt. Kitts and NevisSt. LuciaSt. Vincent and the GrenadinesSwedenSwitzerlandSyrian Arab RepublicTajikistanThailandTimor-LesteTrinidad and TobagoTunisiaTurkeyUgandaUkraineUnited Arab EmiratesUnited KingdomUnited StatesUruguayVenezuela, RBWest Bank and GazaYemen, Rep.

línea de tiempo (timeline):

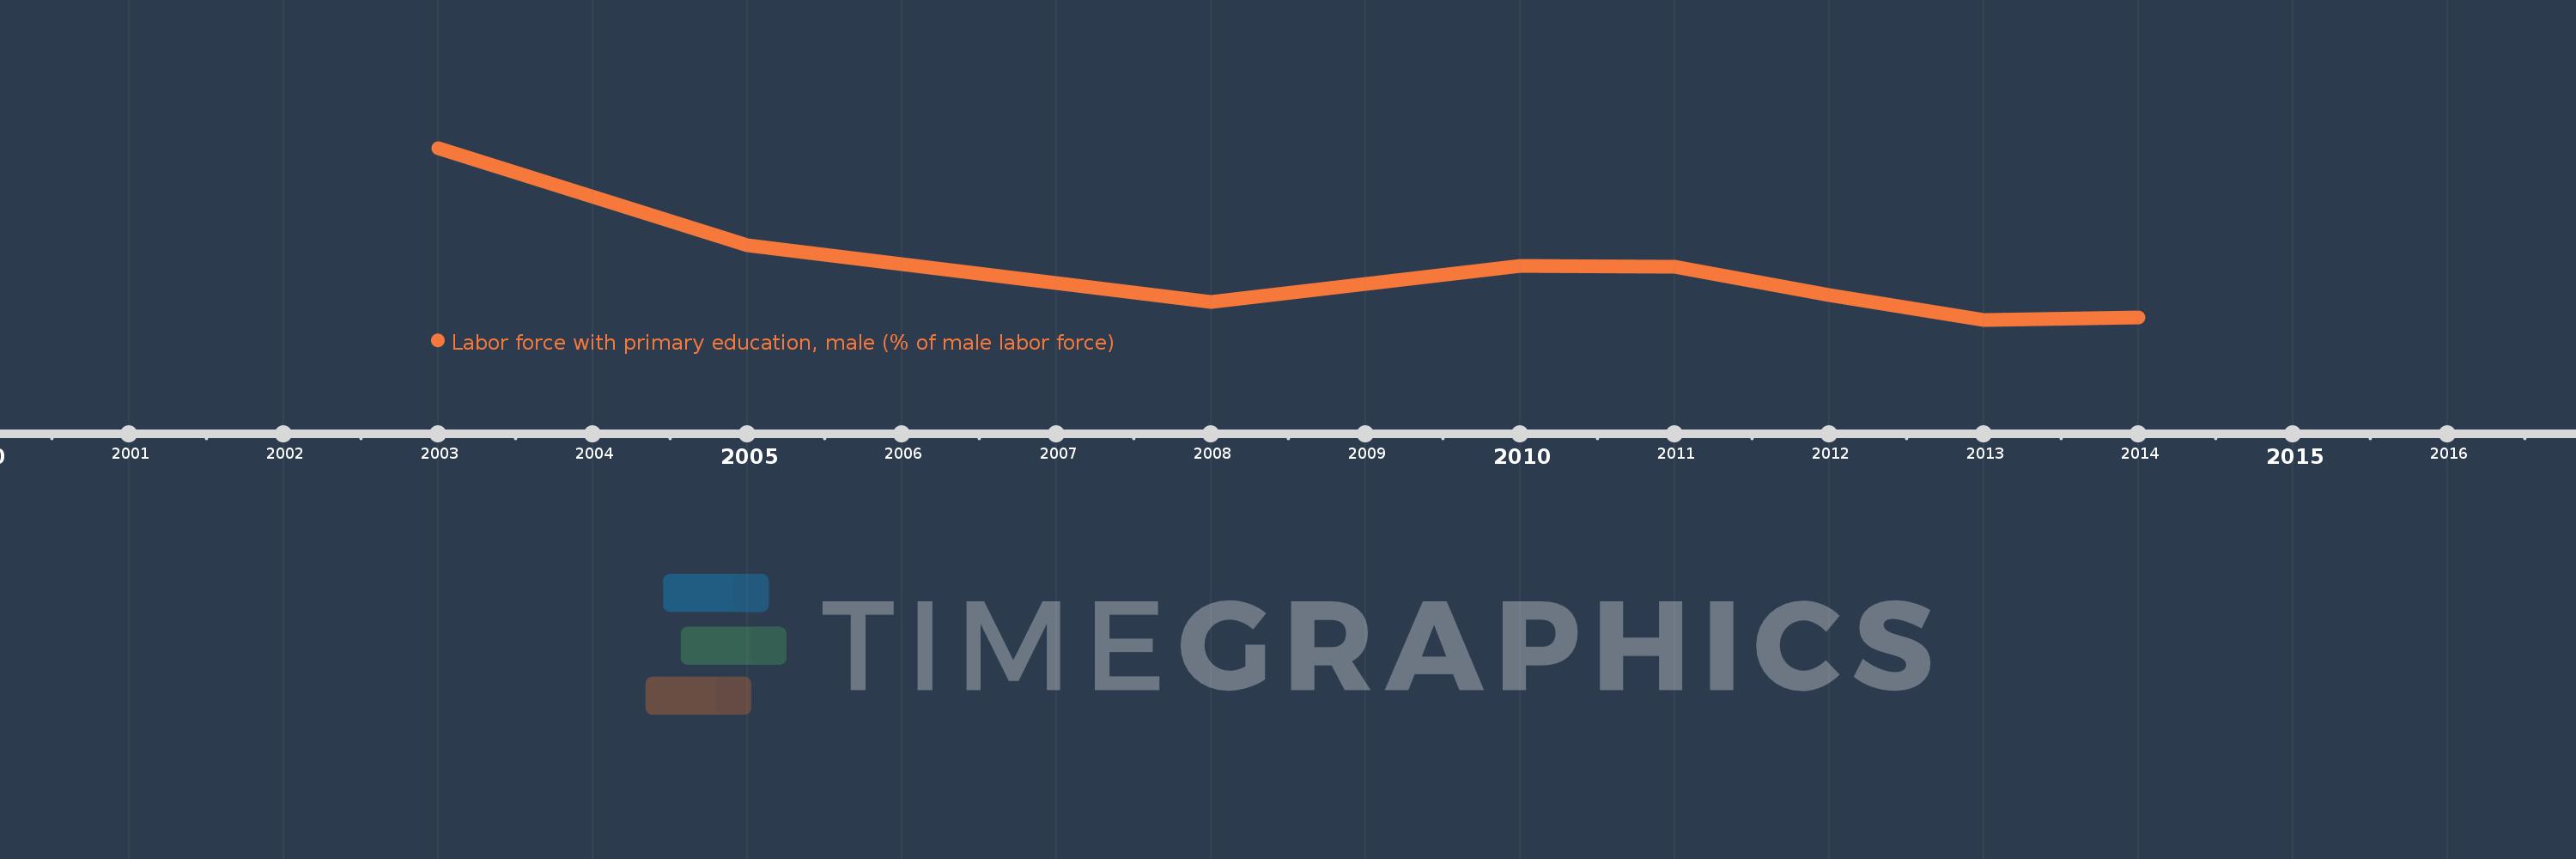
En esta escala de tiempo se presenta un gráfico de 2003 y 2014 de Europe & Central Asia (excluding high income). Los datos de 2002 están ausentes. El número de observaciones reales por fecha: 8.

Fuente (nombre):

Indicadores del desarrollo mundial

Fuente (organización):

International Labour Organization, Key Indicators of the Labour Market database.

Categorías:

Education, Social Protection & Labor, Gender

Se ha actualizado:

23 abr 2017 año

Los indicadores de los cambios de valor en los últimos años

En promedio:
22.691
Mínimo:
21.519
1 ene 2013 año
Máximo:
25.563
1 ene 2003 año
A la fecha de observación
Valor
Cambio absoluto
El cambio con respecto al valor anterior
1 ene 2003 año
25.563
+25.563
0.0%
1 ene 2005 año
23.266
-2.296
-8.98%
1 ene 2008 año
21.938
-1.328
-5.71%
1 ene 2010 año
22.795
+0.856
3.9%
1 ene 2011 año
22.767
-0.028
-0.12%
1 ene 2012 año
22.096
-0.671
-2.95%
1 ene 2013 año
21.519
-0.577
-2.61%
1 ene 2014 año
21.581
+0.063
0.29%

Ranking de los países por los datos estadísticos actuales