29
/es/
es
AIzaSyAYiBZKx7MnpbEhh9jyipgxe19OcubqV5w
April 1, 2024
31755
Europe & Central Asia (excluding high income)
ECA
false
2
1
Labor force with primary education, female (% of female labor force)
2014,2013,2012,2011,2010,2008,2005,2003
Download
Estadísticas Globales de la Biblioteca →Europe & Central Asia (excluding high income) →

Labor force with primary education, female (% of female labor force)

Estas estadísticas en otros países:
AlbaniaAlgeriaAntigua and BarbudaArgentinaArmeniaArubaAustraliaAustriaAzerbaijanBahamas, TheBahrainBarbadosBelarusBelgiumBelizeBermudaBoliviaBosnia and HerzegovinaBotswanaBrazilBritish Virgin IslandsBulgariaCanadaCayman IslandsCentral Europe and the BalticsChadChileColombiaCosta RicaCroatiaCubaCyprusCzech RepublicDenmarkDominicaDominican RepublicEcuadorEgypt, Arab Rep.El SalvadorEstoniaEthiopiaEuro areaEurope & Central AsiaEurope & Central Asia (excluding high income)Europe & Central Asia (IDA & IBRD countries)European UnionFinlandFranceGeorgiaGermanyGhanaGreeceGuatemalaGuyanaHigh incomeHondurasHong Kong SAR, ChinaHungaryIcelandIndiaIndonesiaIran, Islamic Rep.IrelandIsraelItalyJapanJordanKazakhstanKorea, Rep.KuwaitKyrgyz RepublicLatin America & Caribbean Latin America & Caribbean (excluding high income)Latin America & the Caribbean (IDA & IBRD countries)LatviaLebanonLithuaniaLuxembourgMacao SAR, ChinaMacedonia, FYRMadagascarMalaysiaMaltaMauritiusMexicoMoldovaMongoliaMontenegroMoroccoNamibiaNepalNetherlandsNew ZealandNicaraguaNigerNigeriaNorth AmericaNorwayOECD membersOmanPakistanPanamaParaguayPeruPhilippinesPolandPortugalPost-demographic dividendRomaniaRussian FederationRwandaSan MarinoSaudi ArabiaSerbiaSingaporeSlovak RepublicSloveniaSouth AfricaSouth AsiaSouth Asia (IDA & IBRD)SpainSri LankaSt. Kitts and NevisSt. LuciaSt. Vincent and the GrenadinesSwedenSwitzerlandSyrian Arab RepublicTajikistanThailandTimor-LesteTrinidad and TobagoTunisiaTurkeyUgandaUkraineUnited Arab EmiratesUnited KingdomUnited StatesUruguayVenezuela, RBWest Bank and GazaYemen, Rep.
línea de tiempo (timeline):
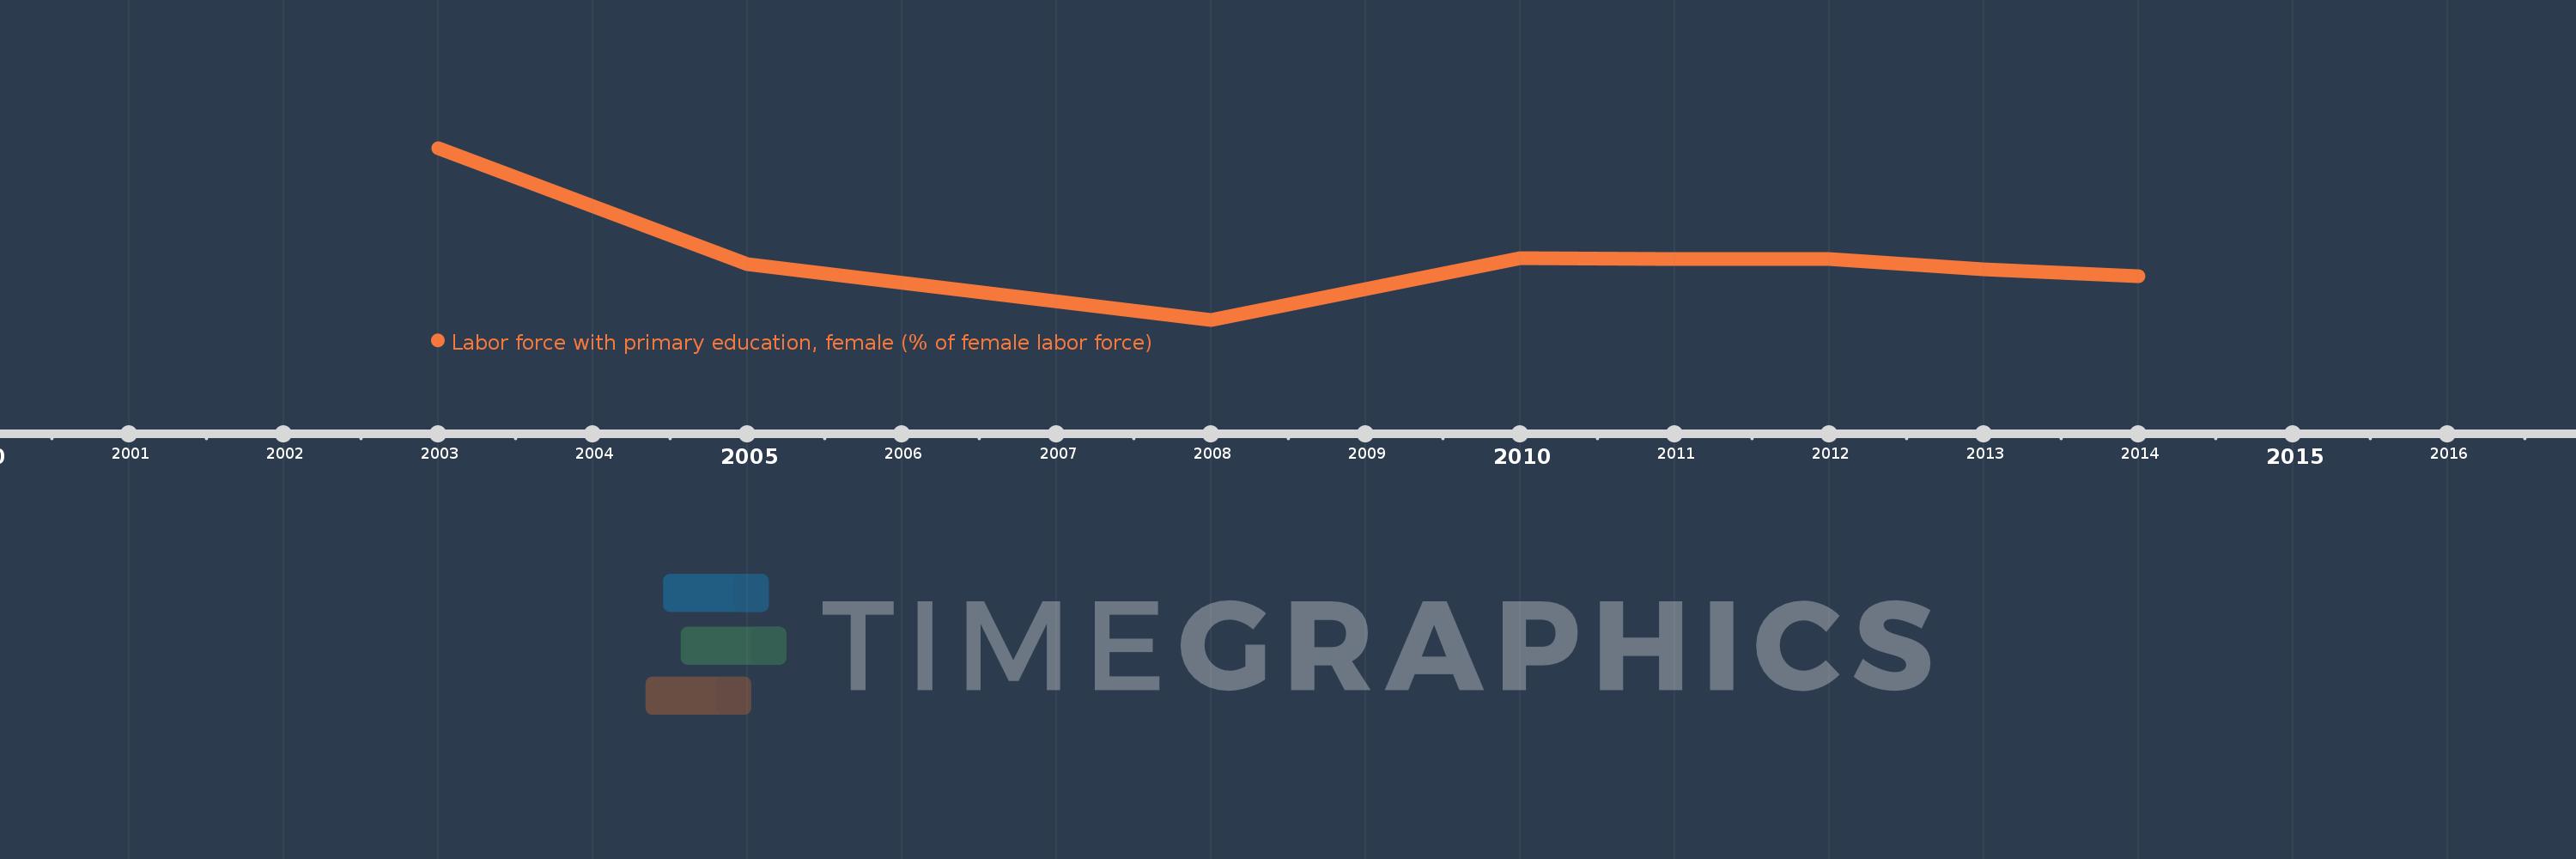
En esta escala de tiempo se presenta un gráfico de 2003 y 2014 de Europe & Central Asia (excluding high income). Los datos de 2002 están ausentes. El número de observaciones reales por fecha: 8.
Fuente (nombre):
Indicadores del desarrollo mundial
Fuente (organización):
International Labour Organization, Key Indicators of the Labour Market database.
Categorías:
Education, Social Protection & Labor, Gender
Se ha actualizado:
23 abr 2017 año
Los indicadores de los cambios de valor en los últimos años
En promedio:
13.809
Mínimo:
11.972
1 ene 2008 año
Máximo:
16.984
1 ene 2003 año
A la fecha de observación
Valor
Cambio absoluto
El cambio con respecto al valor anterior
1 ene 2003 año
16.984
+16.984
0.0%
1 ene 2005 año
13.589
-3.395
-19.99%
1 ene 2008 año
11.972
-1.617
-11.9%
1 ene 2010 año
13.762
+1.789
14.94%
1 ene 2011 año
13.735
-0.027
-0.19%
1 ene 2012 año
13.738
+0.003
0.02%
1 ene 2013 año
13.436
-0.302
-2.2%
1 ene 2014 año
13.254
-0.181
-1.35%
Ranking de los países por los datos estadísticos actuales

Comentarios:

Enviar
PremiumAbout & FeedbackAcuerdoPrivacidad
logo
© 2022 Selected Technologies LLC – Morgan Hill, California