33
/es/
AIzaSyB4mHJ5NPEv-XzF7P6NDYXjlkCWaeKw5bc
November 1, 2025
31746
Europe & Central Asia (excluding high income)
ECA
false
2
1
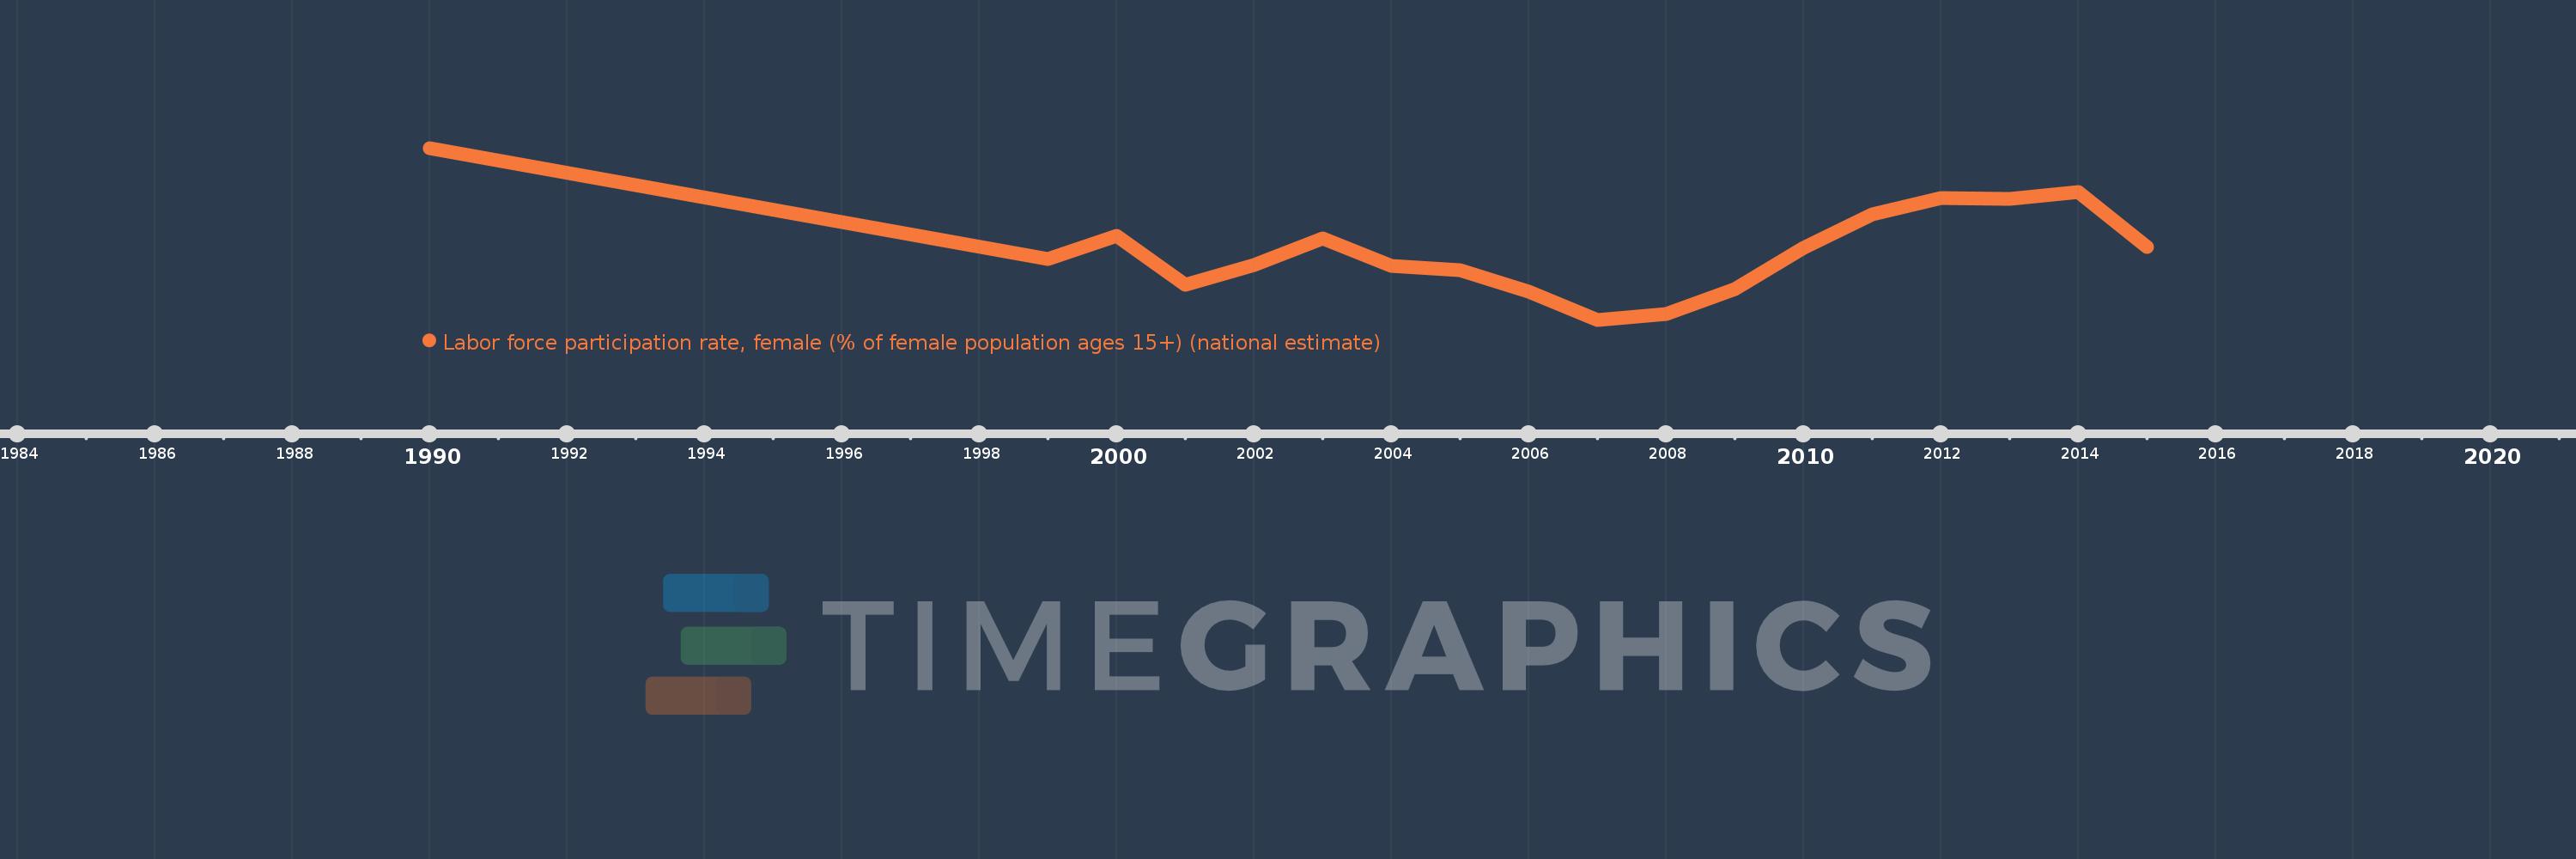
Labor force participation rate, female (% of female population ages 15+) (national estimate)
2015,2014,2013,2012,2011,2010,2009,2008,2007,2006,2005,2004,2003,2002,2001,2000,1999,1990