33
/es/
AIzaSyAYiBZKx7MnpbEhh9jyipgxe19OcubqV5w
August 1, 2025
30833
Europe & Central Asia
ECS
false
2
1
Labor force with tertiary education, male (% of male labor force)
2015,2014,2013,2012,2011,2010,2009,2008,2007,2006,2005,2004,2003,1997,1996
Download
Estadísticas Globales de la Biblioteca →Europe & Central Asia →

Labor force with tertiary education, male (% of male labor force)

Estas estadísticas en otros países:

AlbaniaAlgeriaAntigua and BarbudaArgentinaArmeniaArubaAustraliaAustriaAzerbaijanBahamas, TheBahrainBarbadosBelarusBelgiumBelizeBermudaBoliviaBosnia and HerzegovinaBotswanaBrazilBritish Virgin IslandsBulgariaCanadaCayman IslandsCentral Europe and the BalticsChadChileColombiaCosta RicaCroatiaCubaCyprusCzech RepublicDenmarkDominicaDominican RepublicEarly-demographic dividendEcuadorEgypt, Arab Rep.El SalvadorEstoniaEthiopiaEuro areaEurope & Central AsiaEurope & Central Asia (excluding high income)Europe & Central Asia (IDA & IBRD countries)European UnionFinlandFranceGeorgiaGermanyGhanaGreeceGuatemalaGuyanaHigh incomeHondurasHong Kong SAR, ChinaHungaryIcelandIndiaIndonesiaIran, Islamic Rep.IrelandIsraelItalyJapanJordanKazakhstanKorea, Rep.KuwaitKyrgyz RepublicLatin America & Caribbean Latin America & Caribbean (excluding high income)Latin America & the Caribbean (IDA & IBRD countries)LatviaLebanonLithuaniaLuxembourgMacao SAR, ChinaMacedonia, FYRMadagascarMalaysiaMaltaMauritiusMexicoMoldovaMongoliaMontenegroMoroccoNamibiaNepalNetherlandsNew ZealandNicaraguaNigerNigeriaNorth AmericaNorwayOECD membersOmanPakistanPanamaParaguayPeruPhilippinesPolandPortugalPost-demographic dividendRomaniaRussian FederationRwandaSan MarinoSaudi ArabiaSerbiaSingaporeSlovak RepublicSloveniaSouth AfricaSouth AsiaSouth Asia (IDA & IBRD)SpainSri LankaSt. Kitts and NevisSt. LuciaSt. Vincent and the GrenadinesSwedenSwitzerlandSyrian Arab RepublicTajikistanThailandTimor-LesteTrinidad and TobagoTunisiaTurkeyUgandaUkraineUnited Arab EmiratesUnited KingdomUnited StatesUruguayVenezuela, RBWest Bank and GazaYemen, Rep.

línea de tiempo (timeline):

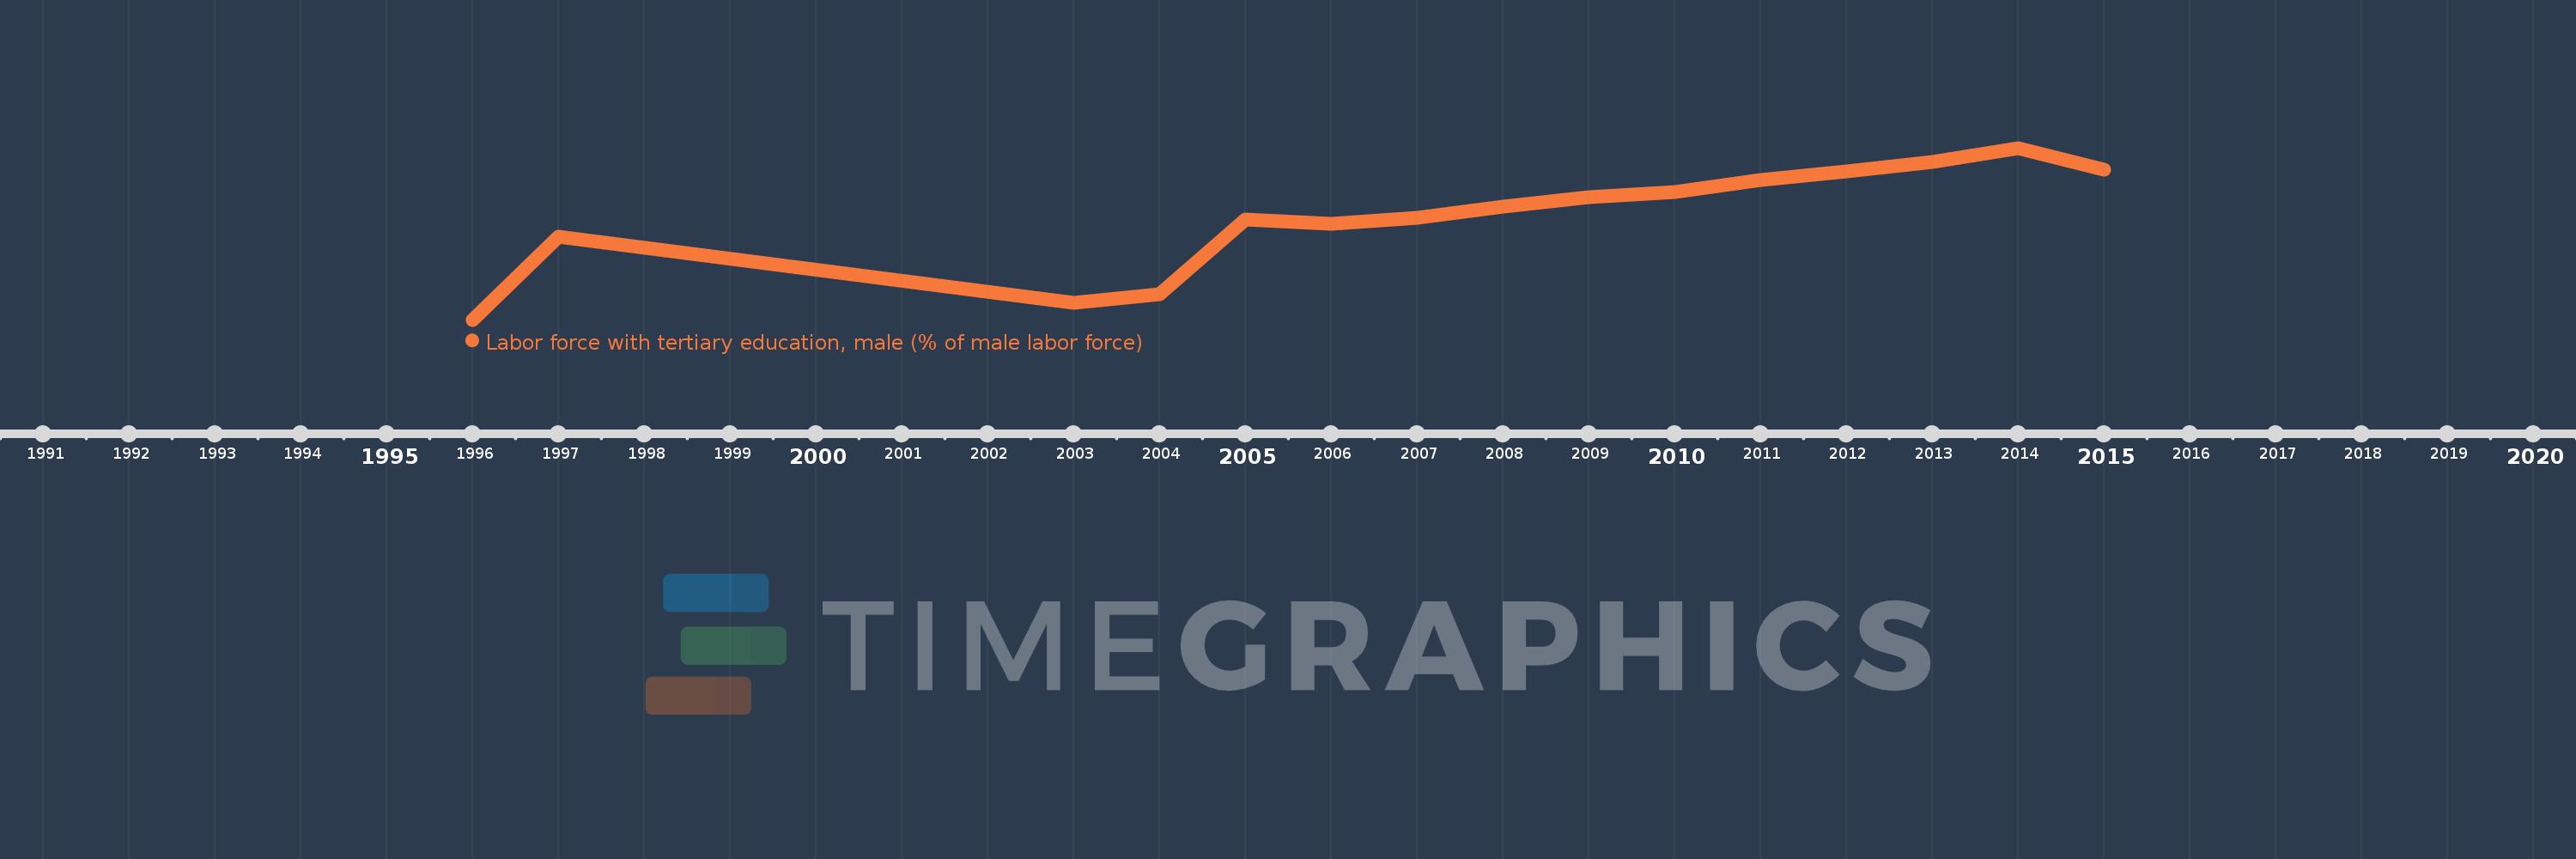
En esta escala de tiempo se presenta un gráfico de 1996 y 2015 de Europe & Central Asia. Los datos de 1995 están ausentes. El número de observaciones reales por fecha: 15.

Fuente (nombre):

Indicadores del desarrollo mundial

Fuente (organización):

International Labour Organization, Key Indicators of the Labour Market database.

Categorías:

Education, Social Protection & Labor, Gender

Se ha actualizado:

23 abr 2017 año

Los indicadores de los cambios de valor en los últimos años

En promedio:
26.045
Mínimo:
19.319
1 ene 1996 año
Máximo:
30.469
1 ene 2014 año
A la fecha de observación
Valor
Cambio absoluto
El cambio con respecto al valor anterior
1 ene 1996 año
19.319
+19.319
0.0%
1 ene 1997 año
24.726
+5.407
27.99%
1 ene 2003 año
20.391
-4.335
-17.53%
1 ene 2004 año
20.993
+0.602
2.95%
1 ene 2005 año
25.808
+4.815
22.94%
1 ene 2006 año
25.531
-0.278
-1.08%
1 ene 2007 año
25.914
+0.384
1.5%
1 ene 2008 año
26.664
+0.749
2.89%
1 ene 2009 año
27.268
+0.604
2.27%
1 ene 2010 año
27.587
+0.32
1.17%
1 ene 2011 año
28.39
+0.803
2.91%
1 ene 2012 año
28.951
+0.561
1.98%
1 ene 2013 año
29.578
+0.627
2.16%
1 ene 2014 año
30.469
+0.891
3.01%
1 ene 2015 año
29.086
-1.382
-4.54%

Ranking de los países por los datos estadísticos actuales