33
/es/
AIzaSyB4mHJ5NPEv-XzF7P6NDYXjlkCWaeKw5bc
November 30, 2025
29532
East Asia & Pacific (IDA & IBRD countries)
TEA
false
2
1
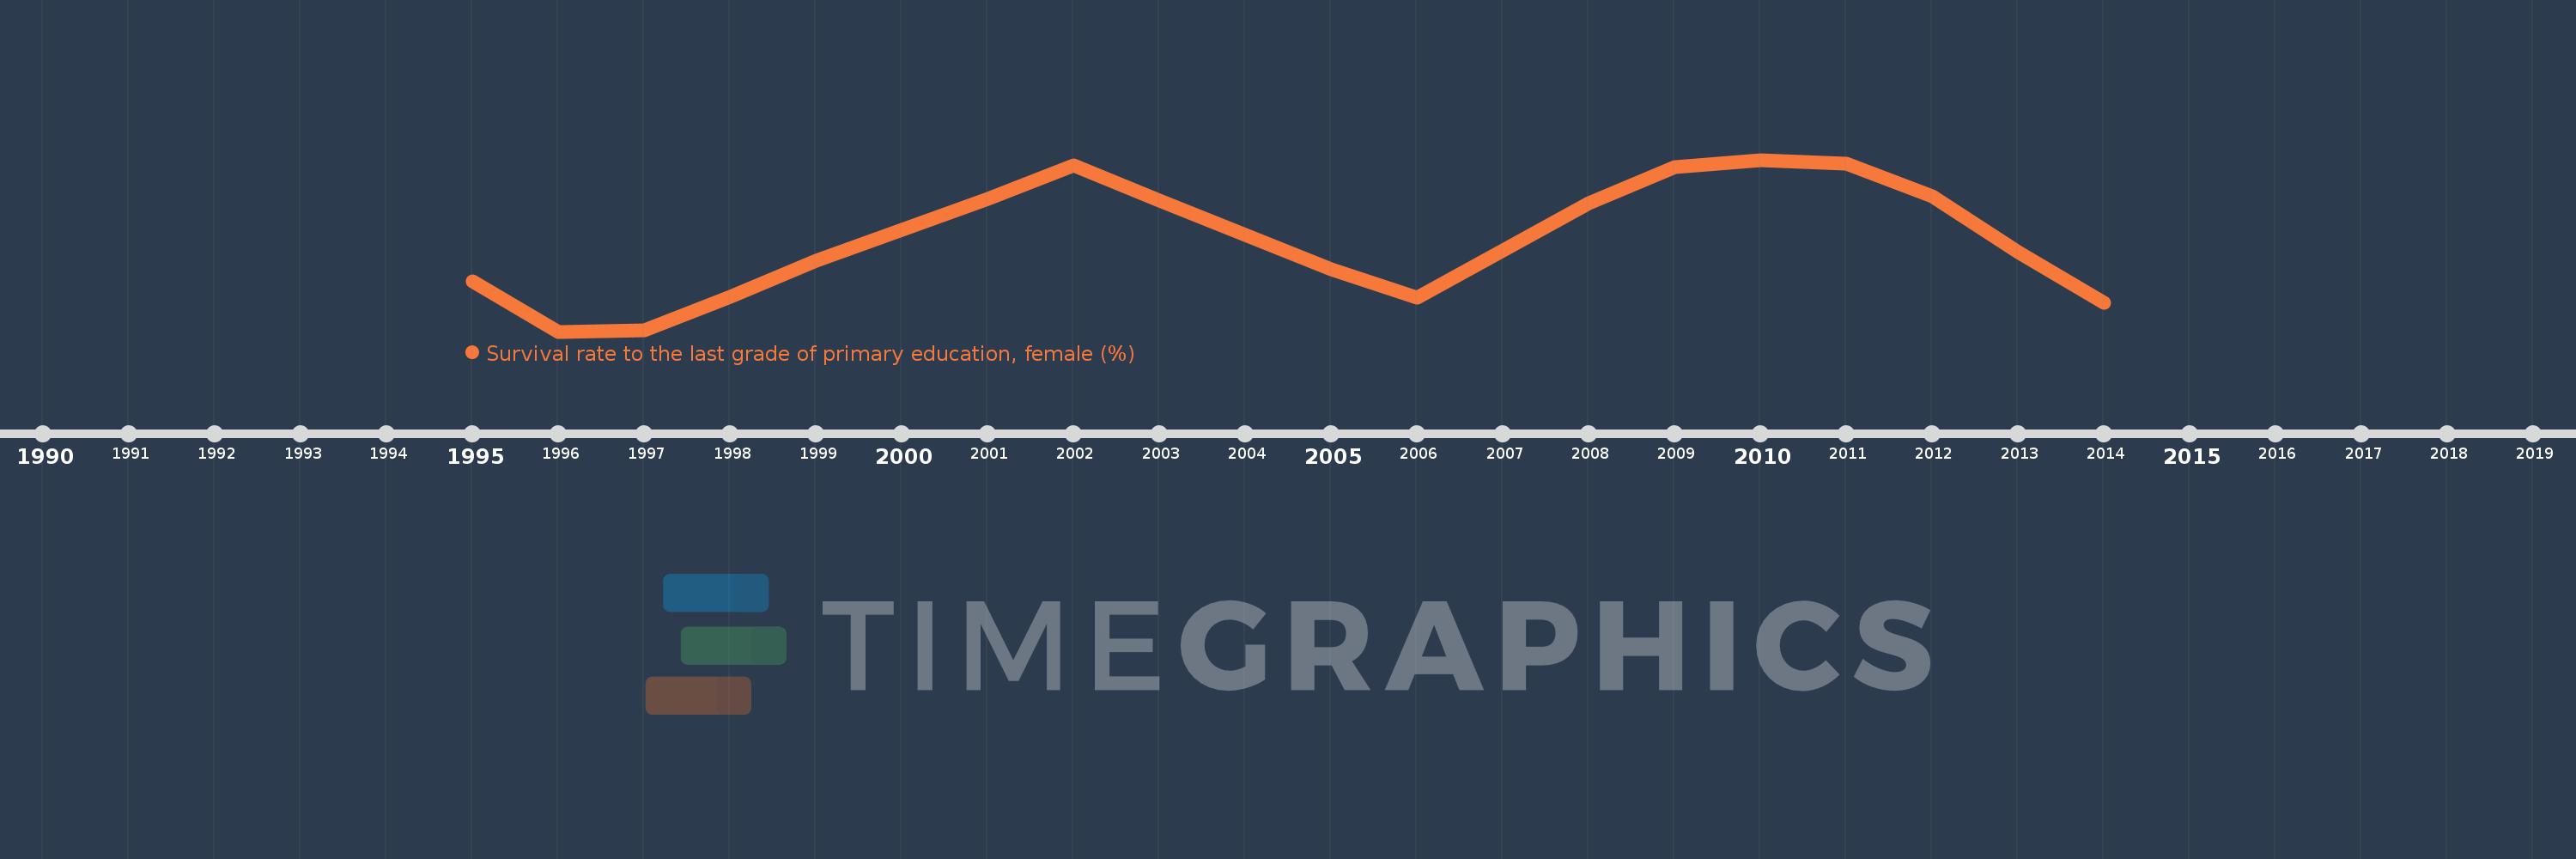
Survival rate to the last grade of primary education, female (%)
2014,2013,2012,2011,2010,2009,2008,2007,2006,2005,2004,2003,2002,2001,2000,1999,1998,1997,1996,1995