33
/es/
AIzaSyAYiBZKx7MnpbEhh9jyipgxe19OcubqV5w
August 1, 2025
283682
West Bank and Gaza
PSE
true
2
1
Gross national expenditure (constant LCU)
2016,2015,2014,2013,2012,2011,2010,2009,2008,2007,2006,2005,2004,2003,2002,2001,2000,1999,1998,1997,1996,1995
Download
Estadísticas Globales de la Biblioteca →West Bank and Gaza →

Gross national expenditure (constant LCU)

Estas estadísticas en otros países:

AlbaniaAlgeriaAngolaAntigua and BarbudaArgentinaArmeniaAustraliaAustriaAzerbaijanBahamas, TheBahrainBangladeshBarbadosBelarusBelgiumBelizeBeninBhutanBoliviaBosnia and HerzegovinaBotswanaBrazilBrunei DarussalamBulgariaBurkina FasoBurundiCabo VerdeCambodiaCameroonCanadaChadChileChinaColombiaComorosCongo, Dem. Rep.Congo, Rep.Costa RicaCote d'IvoireCroatiaCubaCyprusCzech RepublicDenmarkDjiboutiDominican RepublicEcuadorEgypt, Arab Rep.El SalvadorEquatorial GuineaEritreaEstoniaEthiopiaFijiFinlandFranceGabonGambia, TheGeorgiaGermanyGhanaGreeceGuatemalaGuineaGuinea-BissauHaitiHondurasHong Kong SAR, ChinaHungaryIcelandIndiaIndonesiaIran, Islamic Rep.IrelandIsraelItalyJamaicaJapanJordanKazakhstanKenyaKorea, Rep.KosovoKuwaitKyrgyz RepublicLao PDRLatviaLebanonLiberiaLibyaLithuaniaLuxembourgMacao SAR, ChinaMacedonia, FYRMadagascarMalawiMalaysiaMaliMaltaMauritaniaMauritiusMexicoMoldovaMongoliaMontenegroMoroccoMozambiqueMyanmarNamibiaNepalNetherlandsNew ZealandNicaraguaNigerNigeriaNorwayOmanPakistanPanamaPapua New GuineaParaguayPeruPhilippinesPolandPortugalPuerto RicoQatarRomaniaRussian FederationRwandaSamoaSaudi ArabiaSenegalSerbiaSeychellesSierra LeoneSingaporeSlovak RepublicSloveniaSomaliaSouth AfricaSouth SudanSpainSri LankaSudanSurinameSwazilandSwedenSwitzerlandSyrian Arab RepublicTajikistanTanzaniaThailandTimor-LesteTogoTrinidad and TobagoTunisiaTurkeyTurkmenistanUgandaUkraineUnited Arab EmiratesUnited KingdomUnited StatesUruguayUzbekistanVanuatuVenezuela, RBVietnamWest Bank and GazaZambiaZimbabwe

línea de tiempo (timeline):

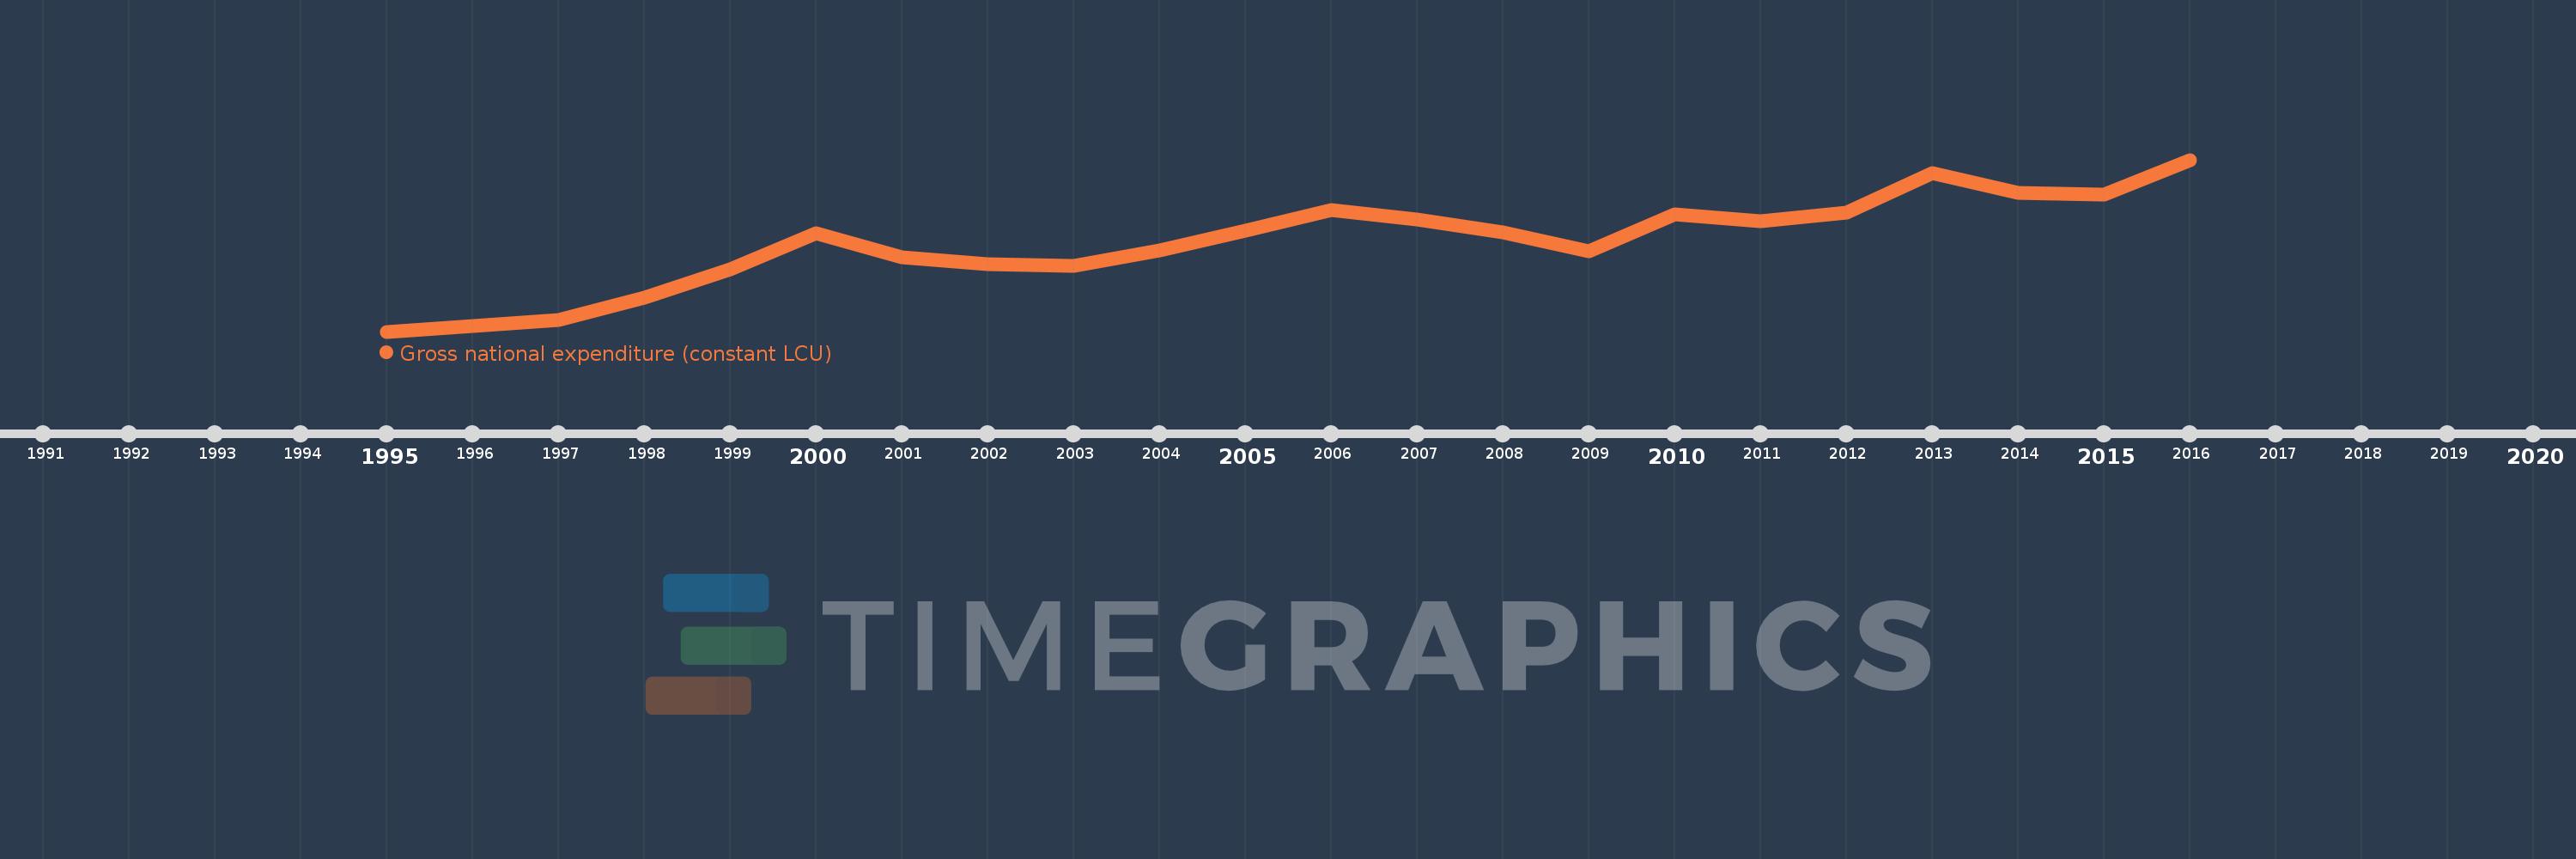
En esta escala de tiempo se presenta un gráfico de 1995 y 2016 de West Bank and Gaza. Los datos de 1994 están ausentes. El número de observaciones reales por fecha: 22.

Fuente (nombre):

Indicadores del desarrollo mundial

Fuente (organización):

World Bank national accounts data, and OECD National Accounts data files.

Categorías:

Economy & Growth

Se ha actualizado:

23 abr 2017 año

Los indicadores de los cambios de valor en los últimos años

En promedio:
28.876 bn
Mínimo:
14.396 bn
1 ene 1995 año
Máximo:
42.221 bn
1 ene 2016 año
A la fecha de observación
Valor
Cambio absoluto
El cambio con respecto al valor anterior
1 ene 1995 año
14.396 bn
+14.396 bn
0.0%
1 ene 1996 año
15.309 bn
+912.778 millones
6.34%
1 ene 1997 año
16.278 bn
+968.841 millones
6.33%
1 ene 1998 año
19.855 bn
+3.577 bn
21.97%
1 ene 1999 año
24.434 bn
+4.579 bn
23.06%
1 ene 2000 año
30.392 bn
+5.958 bn
24.38%
1 ene 2001 año
26.441 bn
-3.95 bn
-13.0%
1 ene 2002 año
25.324 bn
-1.118 bn
-4.23%
1 ene 2003 año
25.056 bn
-267.452 millones
-1.06%
1 ene 2004 año
27.546 bn
+2.489 bn
9.94%
1 ene 2005 año
30.79 bn
+3.245 bn
11.78%
1 ene 2006 año
34.056 bn
+3.265 bn
10.61%
1 ene 2007 año
32.515 bn
-1.541 bn
-4.52%
1 ene 2008 año
30.427 bn
-2.087 bn
-6.42%
1 ene 2009 año
27.46 bn
-2.967 bn
-9.75%
1 ene 2010 año
33.317 bn
+5.857 bn
21.33%
1 ene 2011 año
32.247 bn
-1.07 bn
-3.21%
1 ene 2012 año
33.68 bn
+1.433 bn
4.44%
1 ene 2013 año
40.1 bn
+6.42 bn
19.06%
1 ene 2014 año
36.84 bn
-3.26 bn
-8.13%
1 ene 2015 año
36.596 bn
-244.078 millones
-0.66%
1 ene 2016 año
42.221 bn
+5.625 bn
15.37%

Ranking de los países por los datos estadísticos actuales