33
/es/
AIzaSyB4mHJ5NPEv-XzF7P6NDYXjlkCWaeKw5bc
November 1, 2025
272949
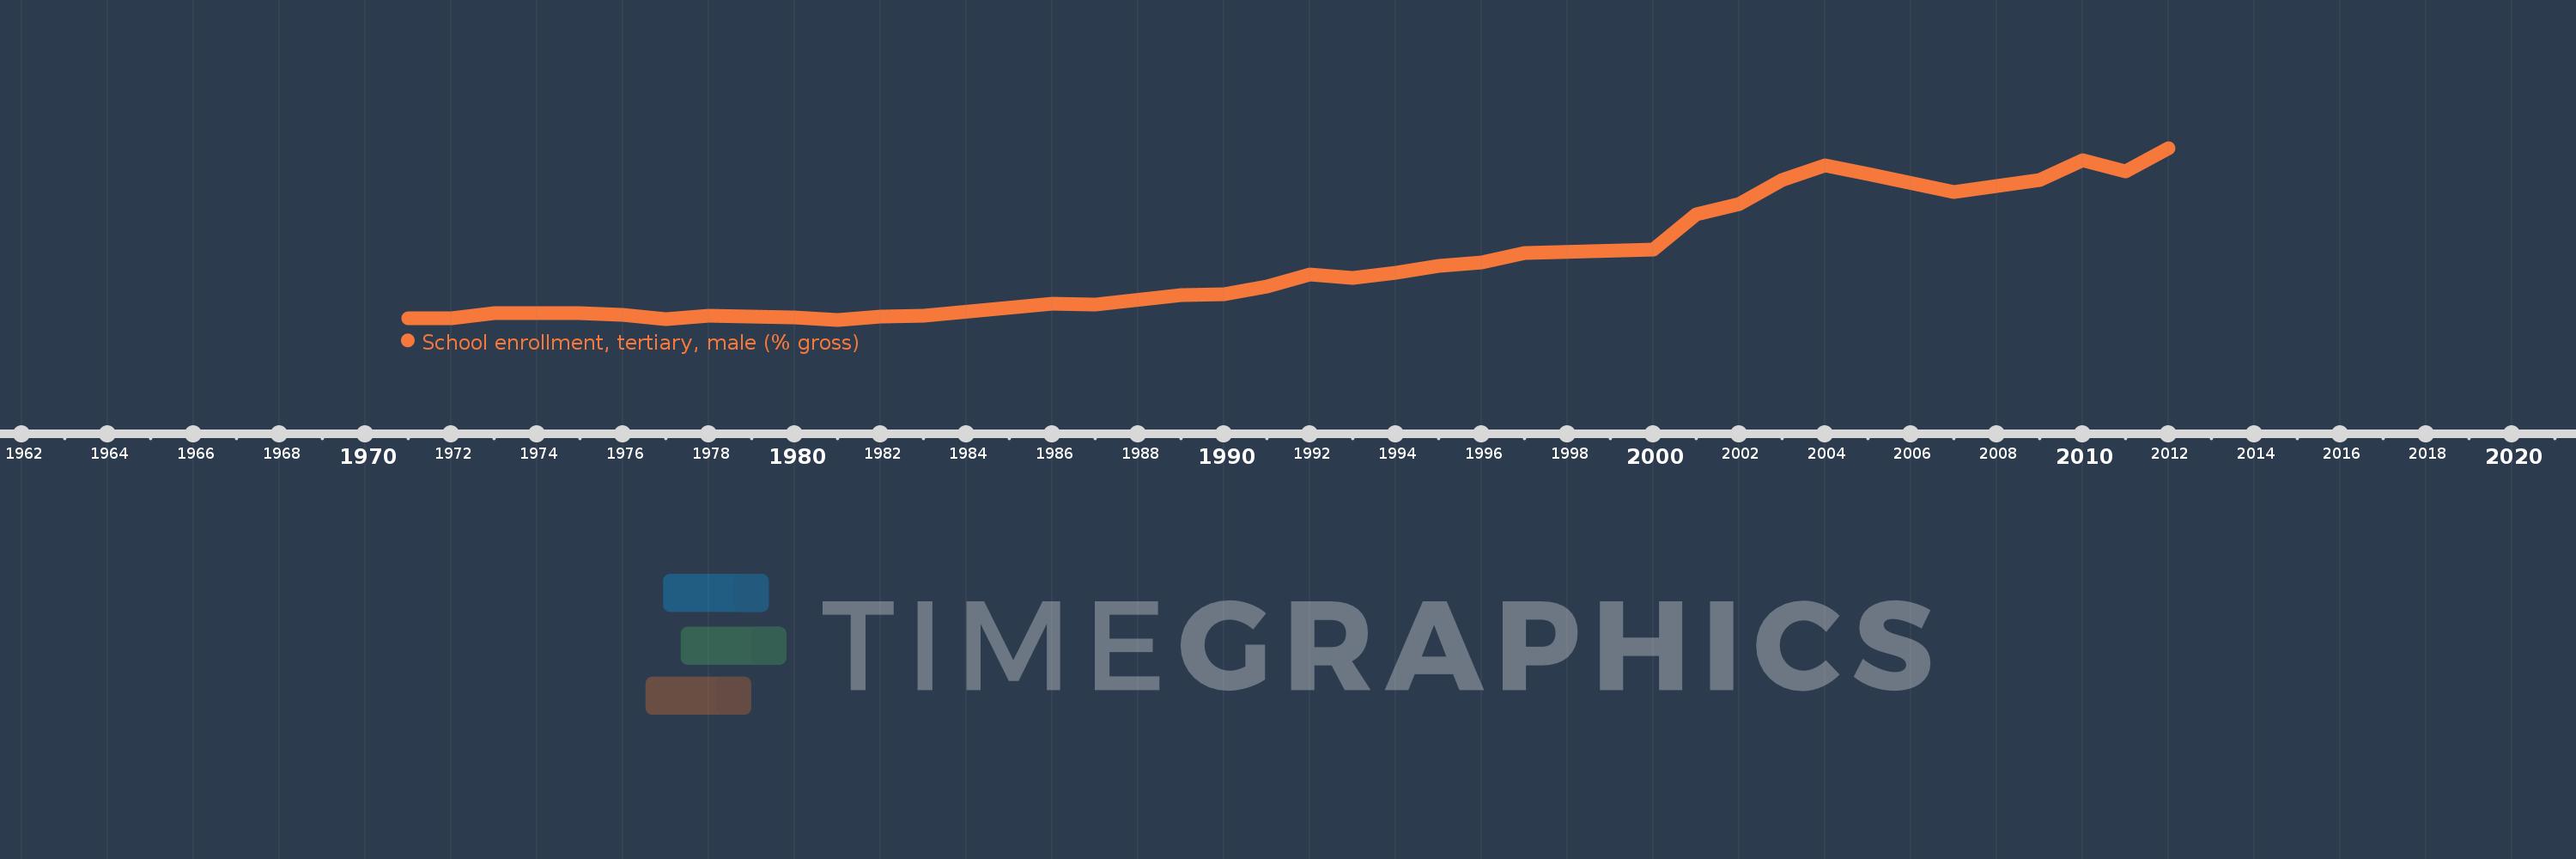
Uganda
UGA
true
2
1
School enrollment, tertiary, male (% gross)
2012,2011,2010,2009,2007,2005,2004,2003,2002,2001,2000,1997,1996,1995,1994,1993,1992,1991,1990,1989,1987,1986,1983,1982,1981,1980,1978,1977,1976,1975,1973,1972,1971