33
/es/
AIzaSyAYiBZKx7MnpbEhh9jyipgxe19OcubqV5w
August 1, 2025
272624
Uganda
UGA
true
2
1
Net financial flows, IBRD (NFL, current US$)
1996,1995,1994,1993,1992,1991,1990,1989,1988,1987,1986,1982,1981,1980,1979,1978,1977,1976,1975,1974,1973,1972,1971
Download
Estadísticas Globales de la Biblioteca →Uganda →

Net financial flows, IBRD (NFL, current US$)

Estas estadísticas en otros países:

AlbaniaAlgeriaAngolaArgentinaArmeniaAzerbaijanBangladeshBelarusBelizeBoliviaBosnia and HerzegovinaBotswanaBrazilBulgariaBurundiCabo VerdeCameroonCaribbean small statesCentral Europe and the BalticsChadChinaColombiaCongo, Dem. Rep.Congo, Rep.Costa RicaCote d'IvoireCroatiaCzech RepublicDominicaDominican RepublicEarly-demographic dividendEast Asia & PacificEast Asia & Pacific (excluding high income)East Asia & Pacific (IDA & IBRD countries)EcuadorEgypt, Arab Rep.El SalvadorEquatorial GuineaEstoniaEthiopiaEurope & Central AsiaEurope & Central Asia (excluding high income)Europe & Central Asia (IDA & IBRD countries)FijiFragile and conflict affected situationsGabonGeorgiaGhanaGreeceGrenadaGuatemalaGuineaGuyanaHondurasHungaryIBRD onlyIDA & IBRD totalIDA blendIDA onlyIDA totalIndiaIndonesiaIran, Islamic Rep.JamaicaJordanKazakhstanKenyaKorea, Rep.KosovoLate-demographic dividendLatin America & Caribbean Latin America & Caribbean (excluding high income)Latin America & the Caribbean (IDA & IBRD countries)LebanonLesothoLiberiaLow & middle incomeLow incomeLower middle incomeMacedonia, FYRMadagascarMalawiMalaysiaMauritaniaMauritiusMexicoMiddle East & North AfricaMiddle East & North Africa (excluding high income)Middle East & North Africa (IDA & IBRD countries)Middle incomeMoldovaMontenegroMoroccoMyanmarNicaraguaNigeriaOmanOther small statesPacific island small statesPakistanPanamaPapua New GuineaParaguayPeruPhilippinesPolandPre-demographic dividendRomaniaRussian FederationSenegalSerbiaSeychellesSierra LeoneSlovak RepublicSloveniaSmall statesSouth AfricaSouth AsiaSouth Asia (IDA & IBRD)Sri LankaSt. Kitts and NevisSt. LuciaSt. Vincent and the GrenadinesSub-Saharan Africa Sub-Saharan Africa (excluding high income)Sub-Saharan Africa (IDA & IBRD countries)SudanSwazilandSyrian Arab RepublicTanzaniaThailandTogoTrinidad and TobagoTunisiaTurkeyTurkmenistanUgandaUkraineUpper middle incomeUzbekistanVenezuela, RBVietnamZambiaZimbabwe

línea de tiempo (timeline):

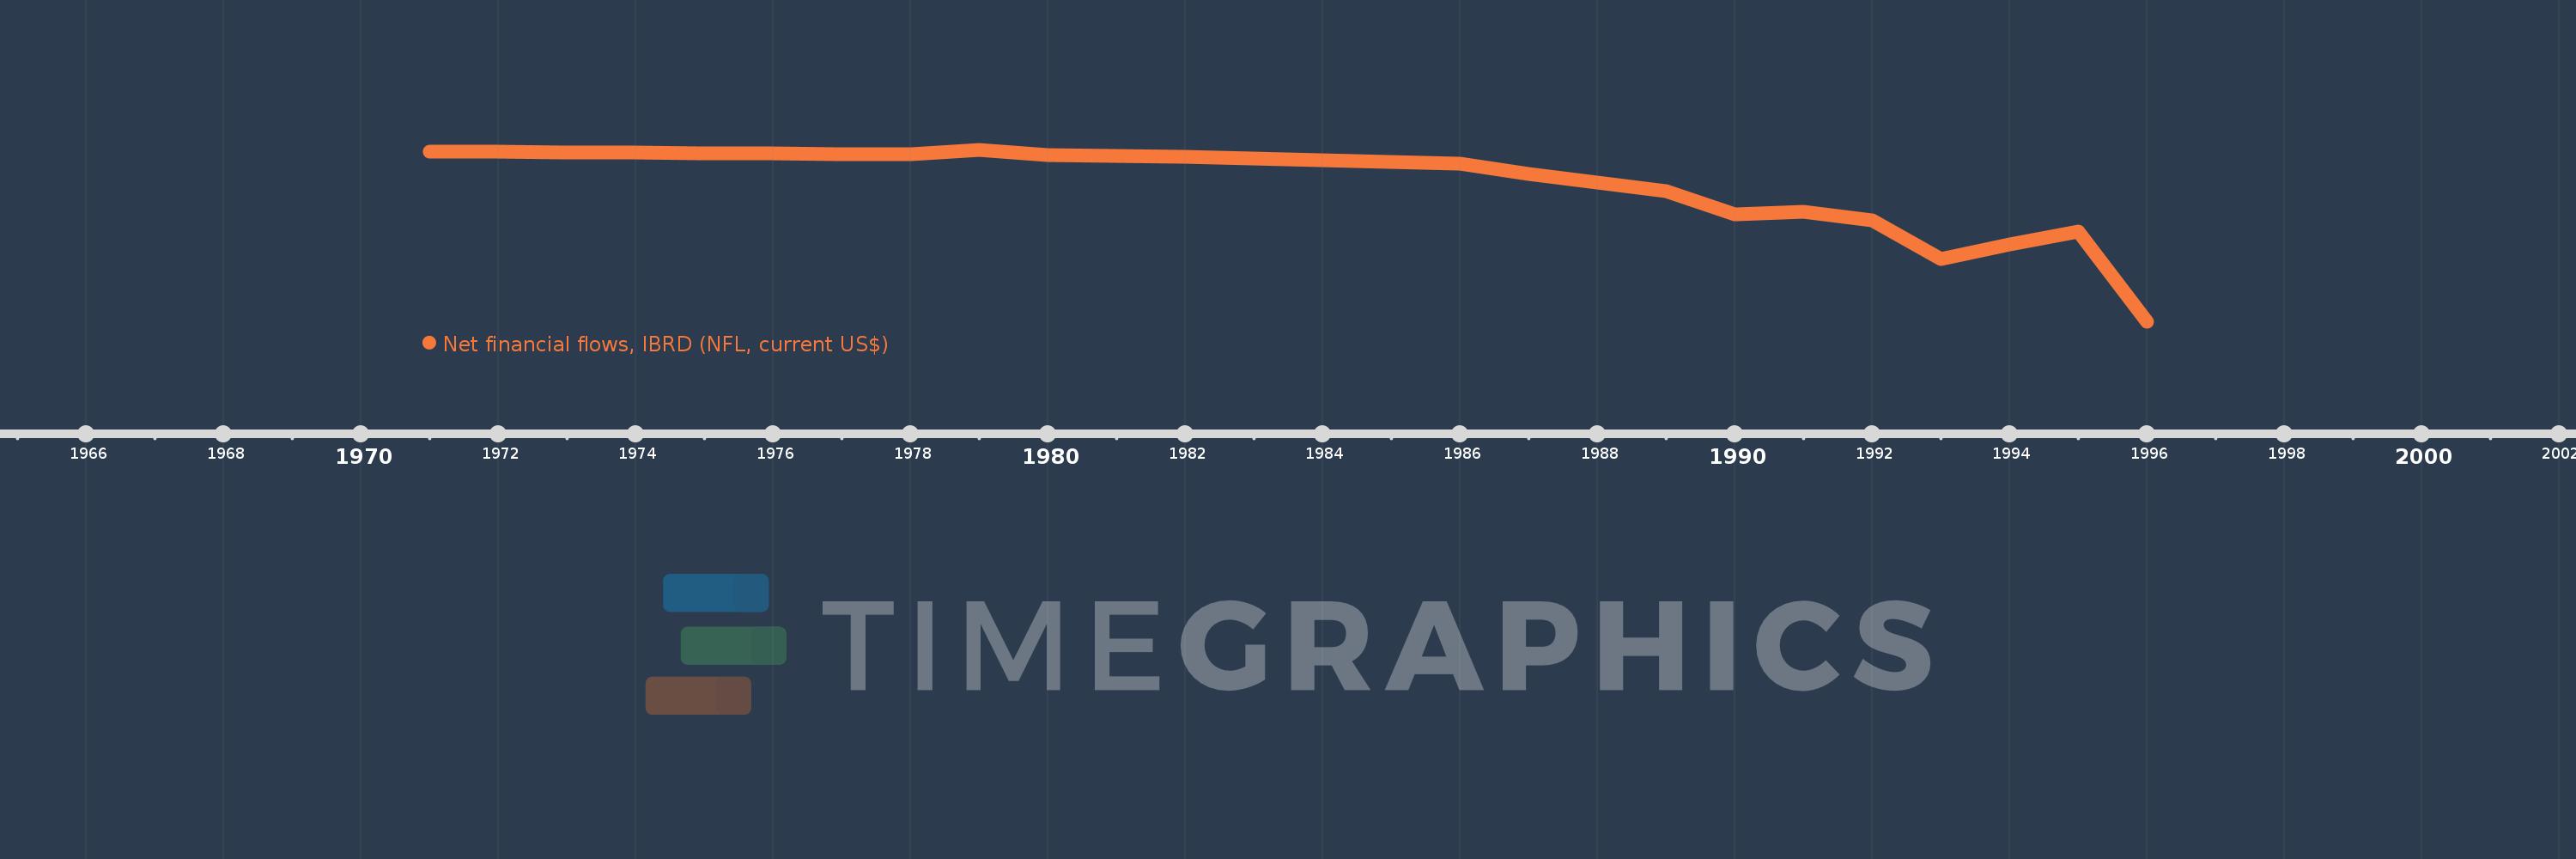
En esta escala de tiempo se presenta un gráfico de 1971 y 1996 de Uganda. Los datos de 1970 están ausentes. El número de observaciones reales por fecha: 23.

Fuente (nombre):

Indicadores del desarrollo mundial

Fuente (organización):

World Bank, International Debt Statistics.

Categorías:

External Debt

Se ha actualizado:

23 abr 2017 año

Los indicadores de los cambios de valor en los últimos años

En promedio:
-2.666 millones
Mínimo:
-11.912 millones
1 ene 1996 año
Máximo:
-315.0 mil
1 ene 1979 año
A la fecha de observación
Valor
Cambio absoluto
El cambio con respecto al valor anterior
1 ene 1971 año
-406.0 mil
-406.0 mil
0.0%
1 ene 1972 año
-430.0 mil
-24.0 mil
5.91%
1 ene 1973 año
-454.0 mil
-24.0 mil
5.58%
1 ene 1974 año
-481.0 mil
-27.0 mil
5.95%
1 ene 1975 año
-509.0 mil
-28.0 mil
5.82%
1 ene 1976 año
-538.0 mil
-29.0 mil
5.7%
1 ene 1977 año
-570.0 mil
-32.0 mil
5.95%
1 ene 1978 año
-603.0 mil
-33.0 mil
5.79%
1 ene 1979 año
-315.0 mil
+288.0 mil
-47.76%
1 ene 1980 año
-657.0 mil
-342.0 mil
108.57%
1 ene 1981 año
-696.0 mil
-39.0 mil
5.94%
1 ene 1982 año
-736.0 mil
-40.0 mil
5.75%
1 ene 1986 año
-1.201 millones
-465.0 mil
63.18%
1 ene 1987 año
-1.921 millones
-720.0 mil
59.95%
1 ene 1988 año
-2.5 millones
-579.0 mil
30.14%
1 ene 1989 año
-3.052 millones
-552.0 mil
22.08%
1 ene 1990 año
-4.655 millones
-1.603 millones
52.52%
1 ene 1991 año
-4.458 millones
+197.0 mil
-4.23%
1 ene 1992 año
-5.061 millones
-603.0 mil
13.53%
1 ene 1993 año
-7.66 millones
-2.599 millones
51.35%
1 ene 1994 año
-6.675 millones
+985.0 mil
-12.86%
1 ene 1995 año
-5.825 millones
+850.0 mil
-12.73%
1 ene 1996 año
-11.912 millones
-6.087 millones
104.5%

Ranking de los países por los datos estadísticos actuales