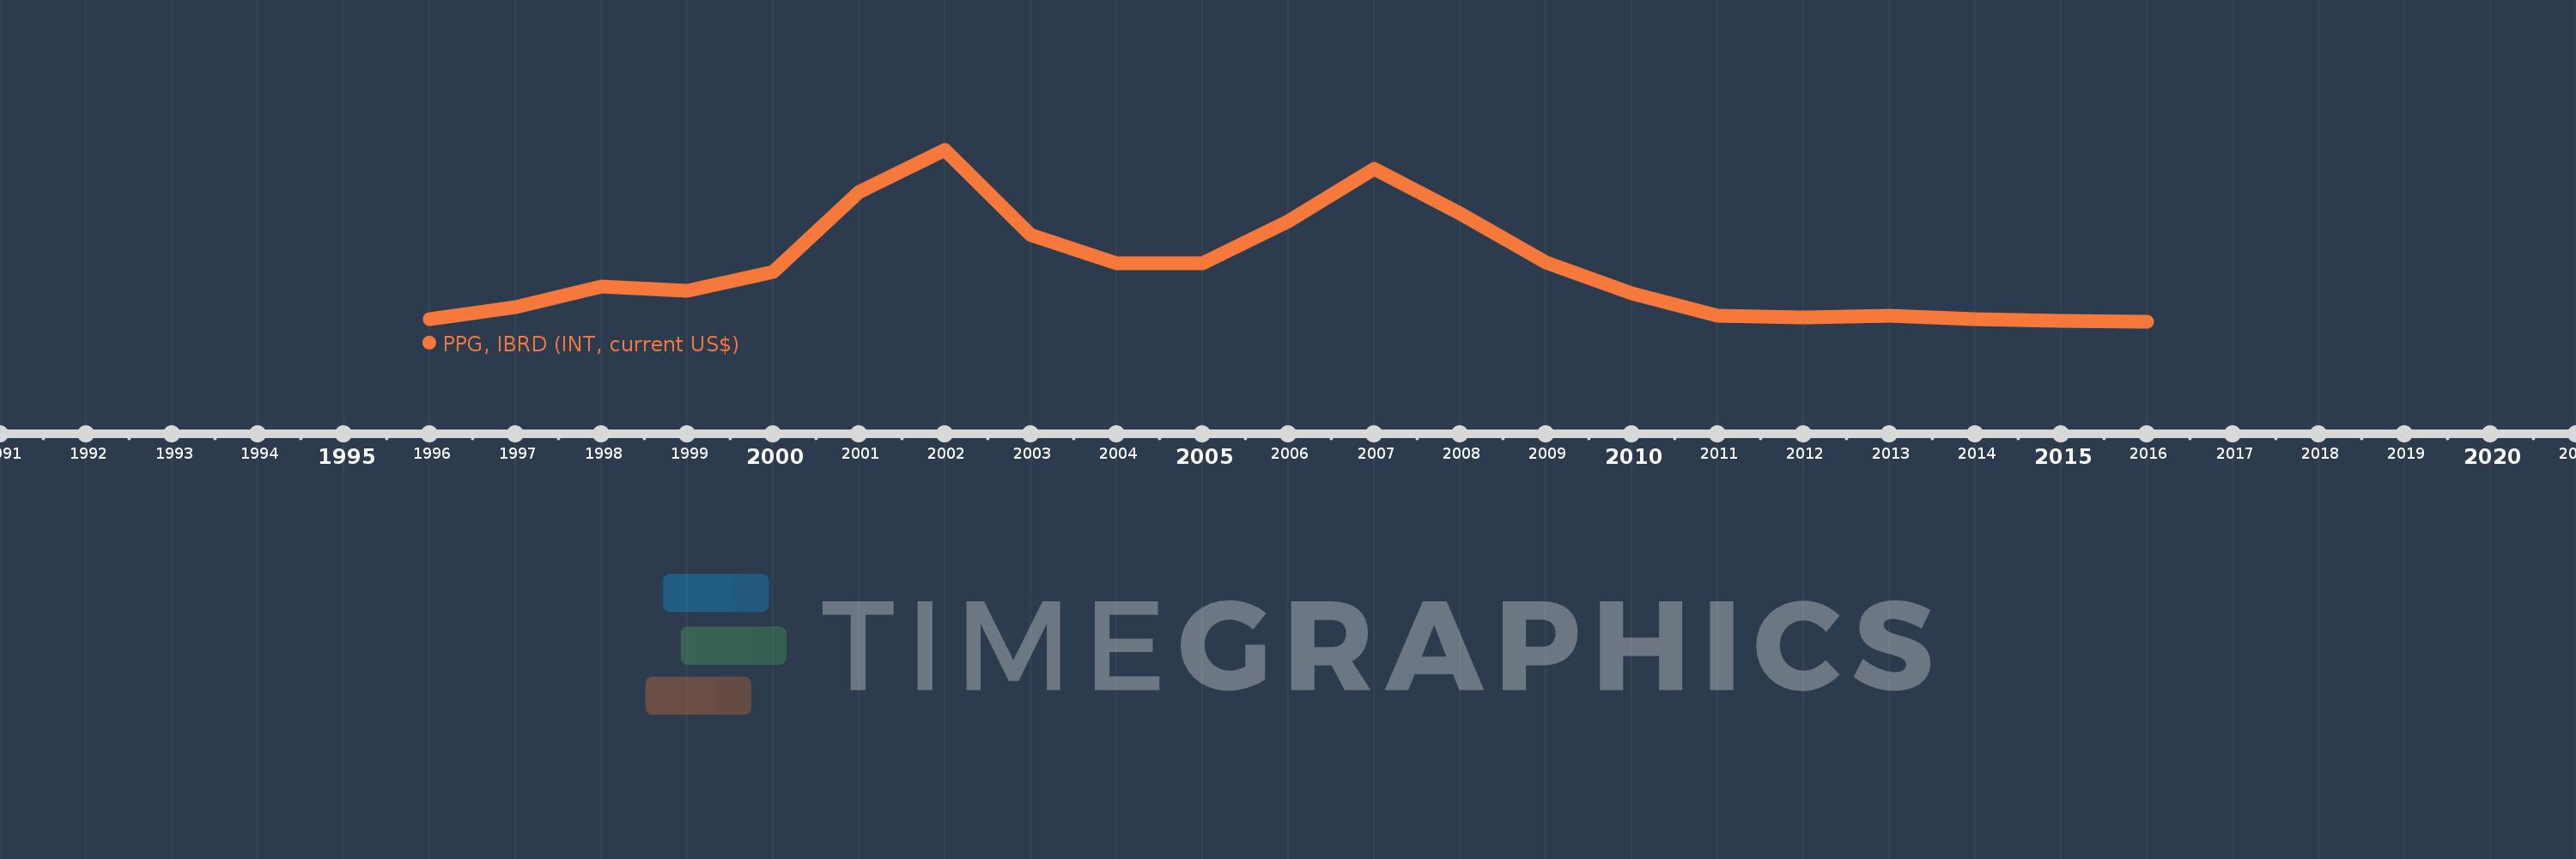
En esta escala de tiempo se presenta un gráfico de 1996 y 2016 de Turkmenistan. Los datos de 1995 están ausentes. El número de observaciones reales por fecha: 21.
Fuente (nombre):
Indicadores del desarrollo mundial
Fuente (organización):
World Bank, International Debt Statistics.
Categorías:
External Debt
Se ha actualizado:
23 abr 2017 año
Los indicadores de los cambios de valor en los últimos años
En promedio:
532.048 mil
Mínimo:
28.0 mil
1 ene 2016 año
Máximo:
1.663 millones
1 ene 2002 año
A la fecha de observación
Valor
Cambio absoluto
El cambio con respecto al valor anterior
1 ene 1996 año
58.0 mil
+58.0 mil
0.0%
1 ene 1997 año
171.0 mil
+113.0 mil
194.83%
1 ene 1998 año
363.0 mil
+192.0 mil
112.28%
1 ene 1999 año
322.0 mil
-41.0 mil
-11.29%
1 ene 2000 año
502.0 mil
+180.0 mil
55.9%
1 ene 2001 año
1.265 millones
+763.0 mil
151.99%
1 ene 2002 año
1.663 millones
+398.0 mil
31.46%
1 ene 2003 año
857.0 mil
-806.0 mil
-48.47%
1 ene 2004 año
590.0 mil
-267.0 mil
-31.16%
1 ene 2005 año
586.0 mil
-4.0 mil
-0.68%
1 ene 2006 año
990.0 mil
+404.0 mil
68.94%
1 ene 2007 año
1.483 millones
+493.0 mil
49.8%
1 ene 2008 año
1.059 millones
-424.0 mil
-28.59%
1 ene 2009 año
597.0 mil
-462.0 mil
-43.63%
1 ene 2010 año
297.0 mil
-300.0 mil
-50.25%
1 ene 2011 año
90.0 mil
-207.0 mil
-69.7%
1 ene 2012 año
73.0 mil
-17.0 mil
-18.89%
1 ene 2013 año
89.0 mil
+16.0 mil
21.92%
1 ene 2014 año
55.0 mil
-34.0 mil
-38.2%
1 ene 2015 año
35.0 mil
-20.0 mil
-36.36%
1 ene 2016 año
28.0 mil
-7.0 mil
-20.0%
Ranking de los países por los datos estadísticos actuales