30
/es/
AIzaSyAYiBZKx7MnpbEhh9jyipgxe19OcubqV5w
April 1, 2024
270018
Turkey
TUR
true
2
1
Researchers in R&D (per million people)
2015,2014,2013,2012,2011,2010,2009,2008,2007,2006,2005,2004,2003,2002,2001,2000,1999,1998,1997
Download
Estadísticas Globales de la Biblioteca →Turkey →

Researchers in R&D (per million people)

Estas estadísticas en otros países:

AlbaniaAlgeriaAmerican SamoaAngolaArgentinaAustraliaAustriaBahrainBelgiumBoliviaBosnia and HerzegovinaBotswanaBrazilBrunei DarussalamBulgariaBurkina FasoCabo VerdeCambodiaCanadaCentral Europe and the BalticsChileChinaColombiaCongo, Rep.Costa RicaCote d'IvoireCroatiaCyprusCzech RepublicDenmarkEarly-demographic dividendEast Asia & PacificEast Asia & Pacific (excluding high income)East Asia & Pacific (IDA & IBRD countries)EcuadorEgypt, Arab Rep.EstoniaEthiopiaEuro areaEurope & Central AsiaEurope & Central Asia (excluding high income)Europe & Central Asia (IDA & IBRD countries)European UnionFaroe IslandsFinlandFranceGambia, TheGeorgiaGermanyGhanaGreeceGreenlandGuamGuatemalaHigh incomeHong Kong SAR, ChinaHungaryIBRD onlyIcelandIDA & IBRD totalIndiaIndonesiaIran, Islamic Rep.IraqIrelandIsraelItalyJapanJordanKazakhstanKenyaKorea, Rep.KuwaitLao PDRLate-demographic dividendLatin America & Caribbean Latin America & Caribbean (excluding high income)Latin America & the Caribbean (IDA & IBRD countries)LatviaLesothoLithuaniaLow & middle incomeLuxembourgMacao SAR, ChinaMacedonia, FYRMadagascarMalawiMalaysiaMaliMaltaMauritiusMexicoMiddle East & North Africa (excluding high income)Middle East & North Africa (IDA & IBRD countries)Middle incomeMoldovaMontenegroMoroccoMozambiqueMyanmarNepalNetherlandsNew ZealandNicaraguaNigerNigeriaNorth AmericaNorwayOECD membersOmanPakistanPanamaParaguayPhilippinesPolandPortugalPost-demographic dividendPuerto RicoQatarRomaniaRussian FederationRwandaSenegalSerbiaSeychellesSingaporeSlovak RepublicSloveniaSouth AfricaSouth AsiaSouth Asia (IDA & IBRD)SpainSri LankaSwedenSwitzerlandTanzaniaThailandTogoTunisiaTurkeyUgandaUkraineUnited KingdomUnited StatesUpper middle incomeUruguayUzbekistanVenezuela, RBVietnamWest Bank and GazaWorldZambiaZimbabwe

línea de tiempo (timeline):

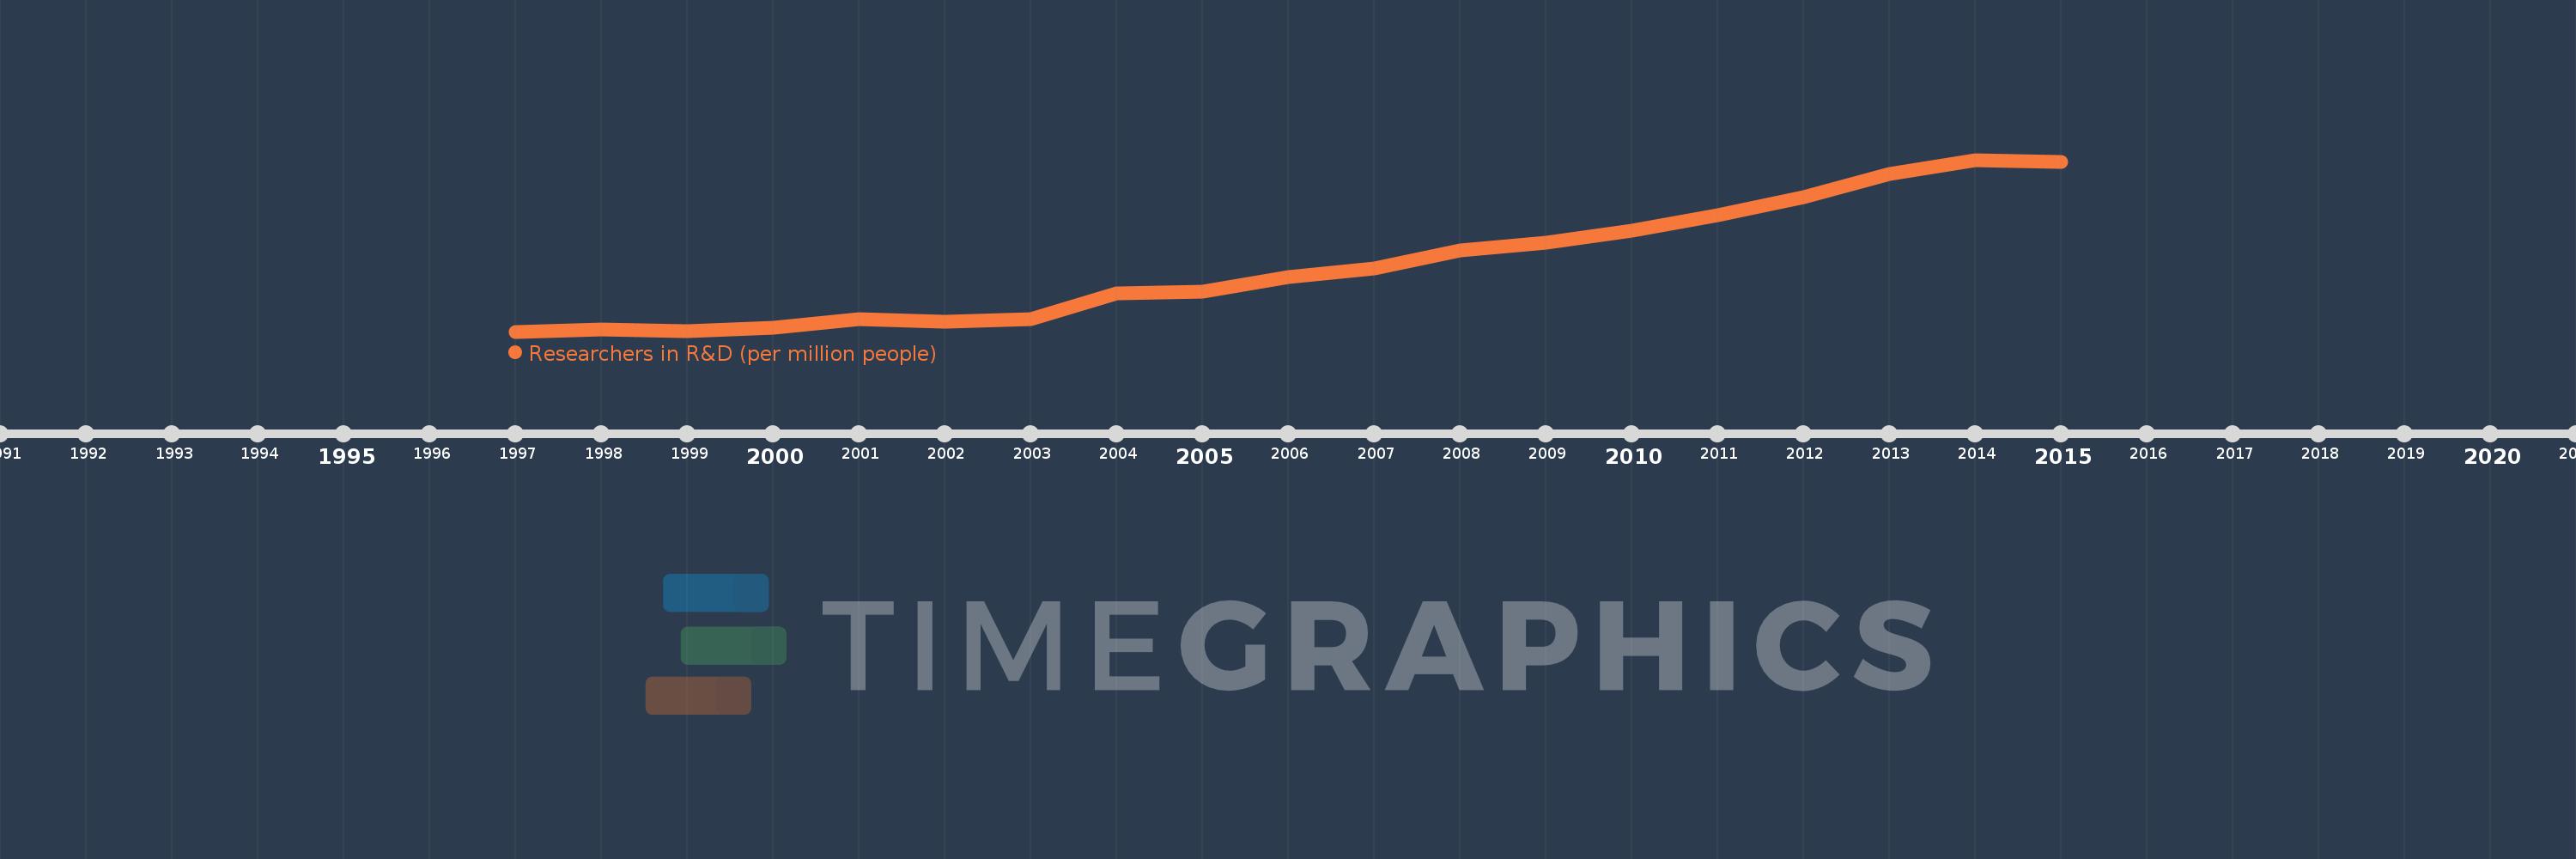
En esta escala de tiempo se presenta un gráfico de 1997 y 2015 de Turkey. Los datos de 1996 están ausentes. El número de observaciones reales por fecha: 19.

Fuente (nombre):

Indicadores del desarrollo mundial

Fuente (organización):

United Nations Educational, Scientific, and Cultural Organization (UNESCO) Institute for Statistics.

Categorías:

Science & Technology

Se ha actualizado:

23 abr 2017 año

Los indicadores de los cambios de valor en los últimos años

En promedio:
636.928
Mínimo:
304.198
1 ene 1997 año
Máximo:
1.169 mil
1 ene 2014 año
A la fecha de observación
Valor
Cambio absoluto
El cambio con respecto al valor anterior
1 ene 1997 año
304.198
+304.198
0.0%
1 ene 1998 año
313.077
+8.879
2.92%
1 ene 1999 año
308.502
-4.575
-1.46%
1 ene 2000 año
322.093
+13.592
4.41%
1 ene 2001 año
365.005
+42.912
13.32%
1 ene 2002 año
353.709
-11.296
-3.09%
1 ene 2003 año
368.441
+14.732
4.16%
1 ene 2004 año
494.398
+125.957
34.19%
1 ene 2005 año
505.82
+11.422
2.31%
1 ene 2006 año
576.755
+70.936
14.02%
1 ene 2007 año
620.969
+44.213
7.67%
1 ene 2008 año
714.486
+93.518
15.06%
1 ene 2009 año
750.748
+36.261
5.08%
1 ene 2010 año
810.518
+59.77
7.96%
1 ene 2011 año
889.788
+79.27
9.78%
1 ene 2012 año
980.842
+91.054
10.23%
1 ene 2013 año
1.097 mil
+116.33
11.86%
1 ene 2014 año
1.169 mil
+71.427
6.51%
1 ene 2015 año
1.157 mil
-12.086
-1.03%

Ranking de los países por los datos estadísticos actuales