33
/es/
AIzaSyB4mHJ5NPEv-XzF7P6NDYXjlkCWaeKw5bc
November 1, 2025
268340
Tunisia
TUN
true
2
1
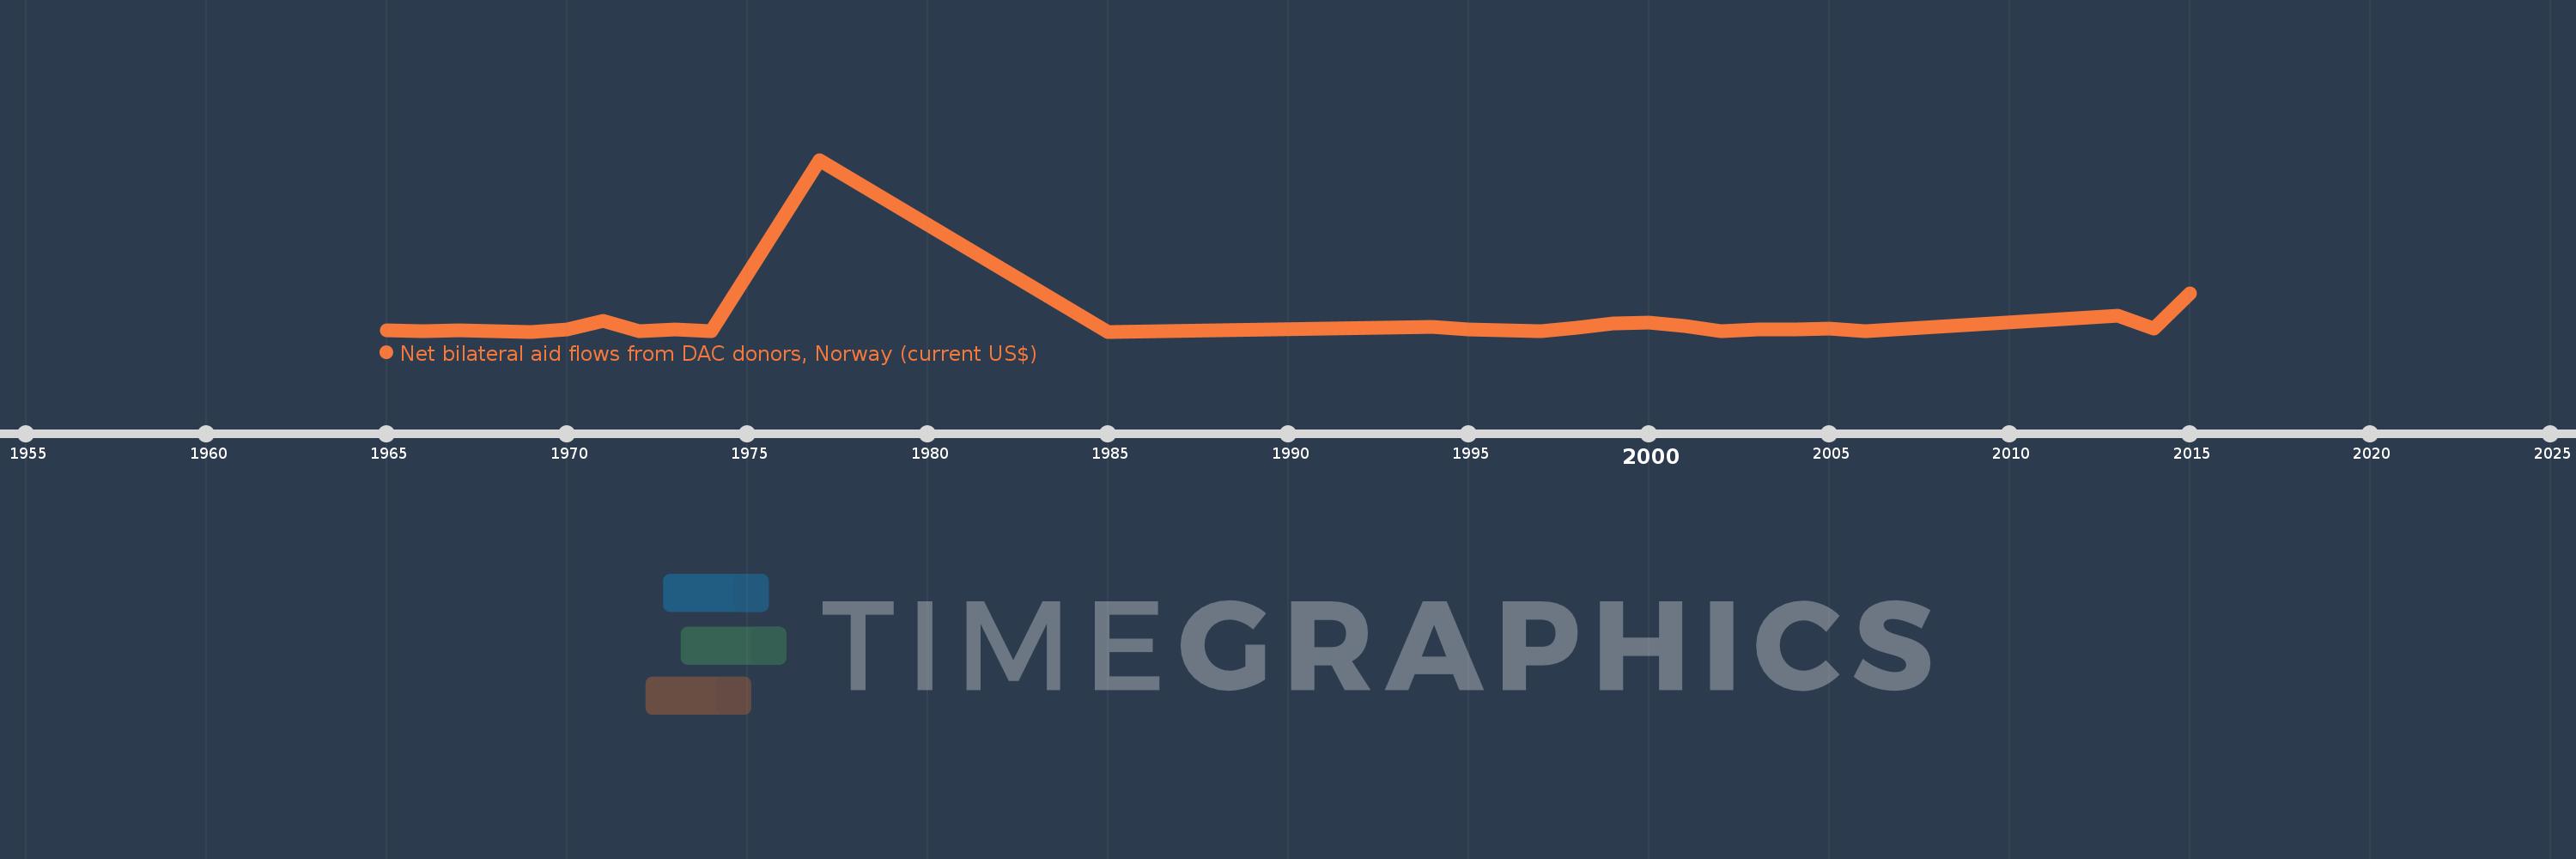
Net bilateral aid flows from DAC donors, Norway (current US$)
2015,2014,2013,2006,2005,2004,2003,2002,2001,2000,1999,1998,1997,1995,1994,1991,1985,1977,1974,1973,1972,1971,1970,1969,1968,1967,1966,1965