29
/es/
es
AIzaSyAYiBZKx7MnpbEhh9jyipgxe19OcubqV5w
April 1, 2024
262876
Thailand
THA
true
2
1
Prevalence of severe wasting, weight for height (% of children under 5)
2013,2007,1988
Download
Estadísticas Globales de la Biblioteca →Thailand →

Prevalence of severe wasting, weight for height (% of children under 5)

Estas estadísticas en otros países:
AfghanistanAlbaniaAlgeriaAngolaArgentinaArmeniaAustraliaAzerbaijanBangladeshBarbadosBelarusBelizeBeninBhutanBoliviaBosnia and HerzegovinaBotswanaBrazilBrunei DarussalamBulgariaBurkina FasoBurundiCambodiaCameroonCanadaCentral African RepublicChadChinaColombiaComorosCongo, Dem. Rep.Congo, Rep.Cote d'IvoireCzech RepublicDjiboutiDominican RepublicEast Asia & PacificEast Asia & Pacific (excluding high income)EcuadorEgypt, Arab Rep.El SalvadorEquatorial GuineaEritreaEthiopiaEurope & Central AsiaEurope & Central Asia (excluding high income)FijiFragile and conflict affected situationsGabonGambia, TheGeorgiaGermanyGhanaGreeceGuatemalaGuineaGuinea-BissauGuyanaHaitiHigh incomeHondurasHungaryIDA & IBRD totalIDA totalIndiaIndonesiaIraqJamaicaJapanJordanKazakhstanKenyaKorea, Dem. People’s Rep.Korea, Rep.KuwaitKyrgyz RepublicLao PDRLatin America & Caribbean Latin America & Caribbean (excluding high income)LebanonLesothoLiberiaLibyaLow & middle incomeLow incomeLower middle incomeMacedonia, FYRMadagascarMalawiMaldivesMaliMauritaniaMexicoMiddle East & North AfricaMiddle East & North Africa (excluding high income)Middle incomeMoldovaMongoliaMontenegroMoroccoMozambiqueMyanmarNamibiaNauruNepalNetherlandsNicaraguaNigerNigeriaNorth AmericaOmanPakistanPanamaPapua New GuineaParaguayPeruPhilippinesRomaniaRwandaSao Tome and PrincipeSaudi ArabiaSenegalSerbiaSeychellesSierra LeoneSingaporeSolomon IslandsSomaliaSouth AfricaSouth AsiaSouth SudanSri LankaSt. LuciaSub-Saharan Africa Sub-Saharan Africa (excluding high income)SudanSurinameSwazilandSyrian Arab RepublicTajikistanTanzaniaThailandTimor-LesteTogoTongaTrinidad and TobagoTunisiaTurkeyTurkmenistanTuvaluUgandaUkraineUnited StatesUpper middle incomeUruguayUzbekistanVanuatuVietnamWest Bank and GazaWorldYemen, Rep.ZambiaZimbabwe
línea de tiempo (timeline):
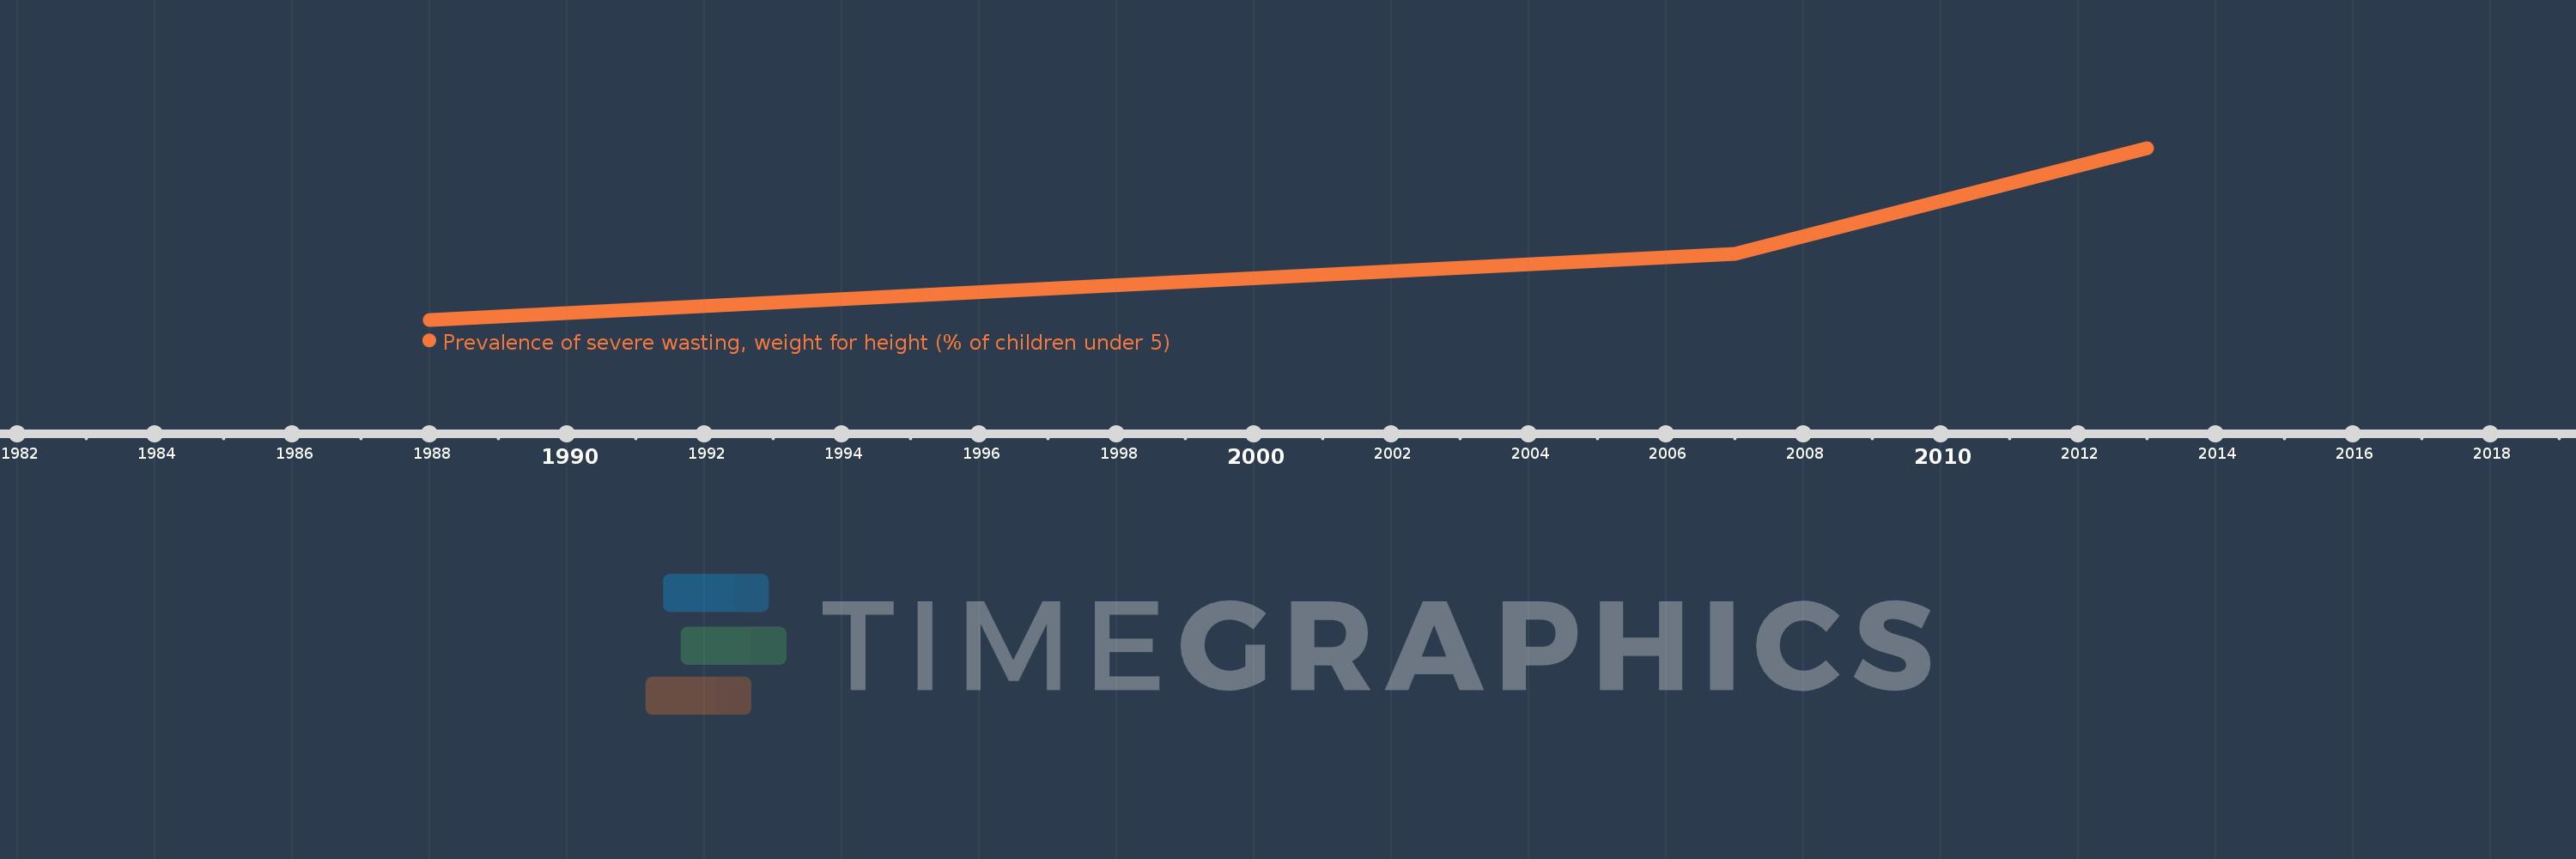
En esta escala de tiempo se presenta un gráfico de 1988 y 2013 de Thailand. Los datos de 1987 están ausentes. El número de observaciones reales por fecha: 3.
Fuente (nombre):
Indicadores del desarrollo mundial
Fuente (organización):
World Health Organization, Global Database on Child Growth and Malnutrition. Country-level data are unadjusted data from national surveys, and thus may not be comparable across countries. Adjusted, comparable data are available at http://www.who.int/nutgrowthdb/en. Aggregation is based on UNICEF, WHO, and the World Bank harmonized dataset (adjusted, comparable data) and methodology.
Categorías:
Health
Se ha actualizado:
23 abr 2017 año
Los indicadores de los cambios de valor en los últimos años
En promedio:
1.5
Mínimo:
0.9
1 ene 1988 año
Máximo:
2.2
1 ene 2013 año
A la fecha de observación
Valor
Cambio absoluto
El cambio con respecto al valor anterior
1 ene 1988 año
0.9
+0.9
0.0%
1 ene 2007 año
1.4
+0.5
55.56%
1 ene 2013 año
2.2
+0.8
57.14%
Ranking de los países por los datos estadísticos actuales

Comentarios:

Enviar
PremiumAbout & FeedbackAcuerdoPrivacidad
logo
© 2022 Selected Technologies LLC – Morgan Hill, California