29
/es/
es
AIzaSyAYiBZKx7MnpbEhh9jyipgxe19OcubqV5w
April 1, 2024
260918
Tanzania
TZA
true
2
1
GNI (current US$)
2016,2015,2014,2013,2012,2011,2010,2009,2008,2007,2006,2005,2004,2003,2002,2001,2000,1999,1998,1997,1996,1995,1994,1993,1992,1991,1990,1989
Download
Estadísticas Globales de la Biblioteca →Tanzania →

GNI (current US$)

Estas estadísticas en otros países:
AfghanistanAlbaniaAlgeriaAmerican SamoaAndorraAngolaAntigua and BarbudaArab WorldArgentinaArmeniaAustraliaAustriaAzerbaijanBahamas, TheBahrainBangladeshBarbadosBelarusBelgiumBelizeBeninBermudaBhutanBoliviaBosnia and HerzegovinaBotswanaBrazilBrunei DarussalamBulgariaBurkina FasoBurundiCabo VerdeCambodiaCameroonCanadaCaribbean small statesCentral African RepublicCentral Europe and the BalticsChadChannel IslandsChileChinaColombiaComorosCongo, Dem. Rep.Congo, Rep.Costa RicaCote d'IvoireCroatiaCubaCyprusCzech RepublicDenmarkDjiboutiDominicaDominican RepublicEarly-demographic dividendEast Asia & PacificEast Asia & Pacific (excluding high income)East Asia & Pacific (IDA & IBRD countries)EcuadorEgypt, Arab Rep.El SalvadorEquatorial GuineaEritreaEstoniaEthiopiaEuro areaEurope & Central AsiaEurope & Central Asia (excluding high income)Europe & Central Asia (IDA & IBRD countries)European UnionFaroe IslandsFijiFinlandFragile and conflict affected situationsFranceFrench PolynesiaGabonGambia, TheGeorgiaGermanyGhanaGreeceGreenlandGrenadaGuatemalaGuineaGuinea-BissauGuyanaHaitiHeavily indebted poor countries (HIPC)High incomeHondurasHong Kong SAR, ChinaHungaryIBRD onlyIcelandIDA & IBRD totalIDA blendIDA onlyIDA totalIndiaIndonesiaIran, Islamic Rep.IraqIrelandIsle of ManIsraelItalyJamaicaJapanJordanKazakhstanKenyaKiribatiKorea, Rep.KosovoKuwaitKyrgyz RepublicLao PDRLate-demographic dividendLatin America & Caribbean Latin America & Caribbean (excluding high income)Latin America & the Caribbean (IDA & IBRD countries)LatviaLeast developed countries: UN classificationLebanonLesothoLiberiaLibyaLiechtensteinLithuaniaLow & middle incomeLow incomeLower middle incomeLuxembourgMacao SAR, ChinaMacedonia, FYRMadagascarMalawiMalaysiaMaldivesMaliMaltaMarshall IslandsMauritaniaMauritiusMexicoMicronesia, Fed. Sts.Middle East & North AfricaMiddle East & North Africa (excluding high income)Middle East & North Africa (IDA & IBRD countries)Middle incomeMoldovaMonacoMongoliaMontenegroMoroccoMozambiqueMyanmarNamibiaNauruNepalNetherlandsNew CaledoniaNew ZealandNicaraguaNigerNigeriaNorth AmericaNorwayOECD membersOmanOther small statesPacific island small statesPakistanPalauPanamaPapua New GuineaParaguayPeruPhilippinesPolandPortugalPost-demographic dividendPre-demographic dividendPuerto RicoQatarRomaniaRussian FederationRwandaSamoaSan MarinoSao Tome and PrincipeSaudi ArabiaSenegalSerbiaSeychellesSierra LeoneSingaporeSlovak RepublicSloveniaSmall statesSolomon IslandsSomaliaSouth AfricaSouth AsiaSouth Asia (IDA & IBRD)South SudanSpainSri LankaSt. Kitts and NevisSt. LuciaSt. Vincent and the GrenadinesSub-Saharan Africa Sub-Saharan Africa (excluding high income)Sub-Saharan Africa (IDA & IBRD countries)SudanSurinameSwazilandSwedenSwitzerlandSyrian Arab RepublicTajikistanTanzaniaThailandTimor-LesteTogoTongaTrinidad and TobagoTunisiaTurkeyTurkmenistanTuvaluUgandaUkraineUnited Arab EmiratesUnited KingdomUnited StatesUpper middle incomeUruguayUzbekistanVanuatuVenezuela, RBVietnamVirgin Islands (U.S.)West Bank and GazaWorldYemen, Rep.ZambiaZimbabwe
línea de tiempo (timeline):
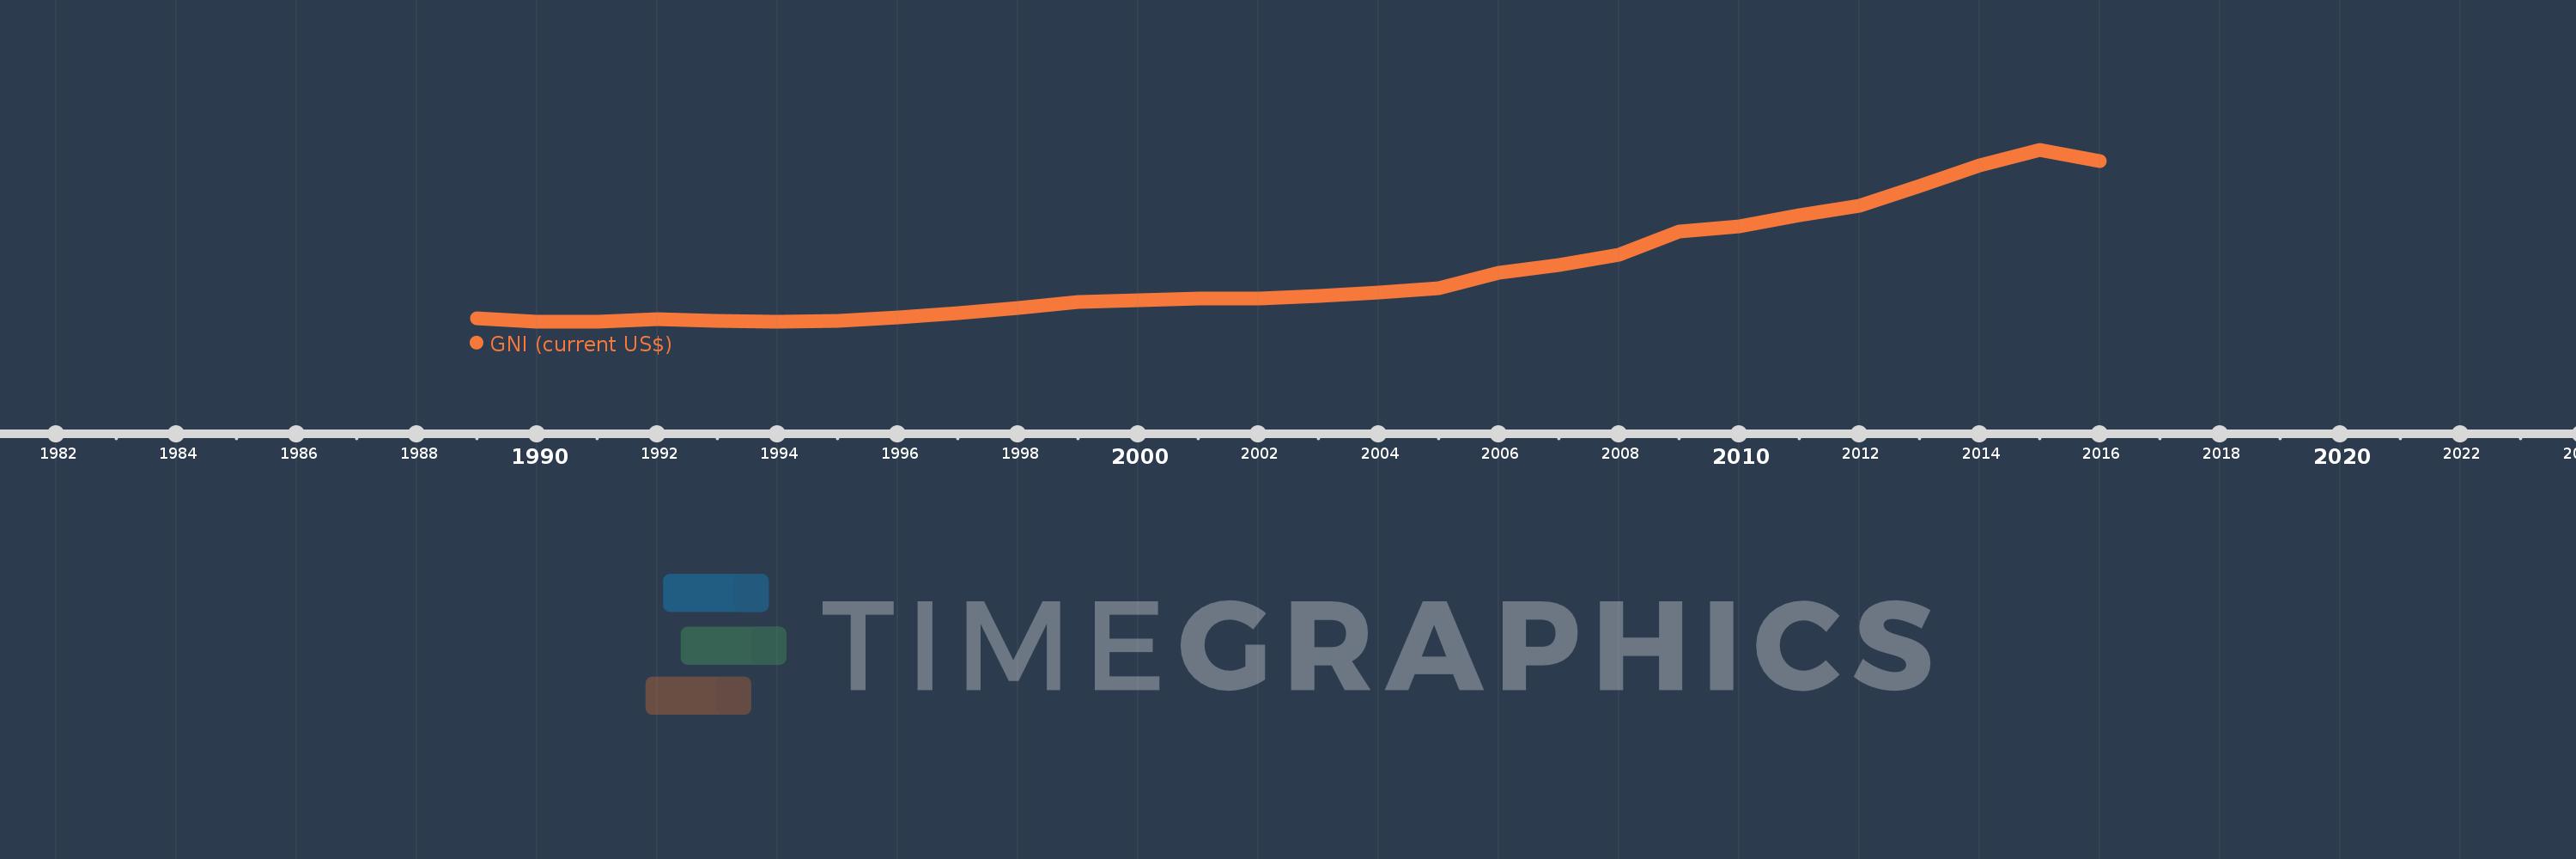
En esta escala de tiempo se presenta un gráfico de 1989 y 2016 de Tanzania. Los datos de 1988 están ausentes. El número de observaciones reales por fecha: 28.
Fuente (nombre):
Indicadores del desarrollo mundial
Fuente (organización):
World Bank national accounts data, and OECD National Accounts data files.
Categorías:
Economy & Growth, External Debt
Se ha actualizado:
23 abr 2017 año
Los indicadores de los cambios de valor en los últimos años
En promedio:
16.968 bn
Mínimo:
4.072 bn
1 ene 1991 año
Máximo:
47.679 bn
1 ene 2015 año
A la fecha de observación
Valor
Cambio absoluto
El cambio con respecto al valor anterior
1 ene 1989 año
4.92 bn
+4.92 bn
0.0%
1 ene 1990 año
4.241 bn
-678.738 millones
-13.8%
1 ene 1991 año
4.072 bn
-168.775 millones
-3.98%
1 ene 1992 año
4.771 bn
+698.846 millones
17.16%
1 ene 1993 año
4.414 bn
-356.825 millones
-7.48%
1 ene 1994 año
4.094 bn
-320.711 millones
-7.27%
1 ene 1995 año
4.357 bn
+263.445 millones
6.44%
1 ene 1996 año
5.126 bn
+768.705 millones
17.64%
1 ene 1997 año
6.424 bn
+1.298 bn
25.33%
1 ene 1998 año
7.562 bn
+1.138 bn
17.72%
1 ene 1999 año
9.24 bn
+1.678 bn
22.19%
1 ene 2000 año
9.603 bn
+362.666 millones
3.92%
1 ene 2001 año
10.056 bn
+452.84 millones
4.72%
1 ene 2002 año
10.063 bn
+7.091 millones
0.07%
1 ene 2003 año
10.708 bn
+645.341 millones
6.41%
1 ene 2004 año
11.465 bn
+756.405 millones
7.06%
1 ene 2005 año
12.596 bn
+1.131 bn
9.87%
1 ene 2006 año
16.575 bn
+3.979 bn
31.59%
1 ene 2007 año
18.588 bn
+2.013 bn
12.14%
1 ene 2008 año
21.22 bn
+2.632 bn
14.16%
1 ene 2009 año
27.054 bn
+5.835 bn
27.5%
1 ene 2010 año
28.276 bn
+1.222 bn
4.52%
1 ene 2011 año
31.078 bn
+2.802 bn
9.91%
1 ene 2012 año
33.619 bn
+2.541 bn
8.18%
1 ene 2013 año
38.51 bn
+4.89 bn
14.55%
1 ene 2014 año
43.922 bn
+5.413 bn
14.06%
1 ene 2015 año
47.679 bn
+3.756 bn
8.55%
1 ene 2016 año
44.867 bn
-2.811 bn
-5.9%
Ranking de los países por los datos estadísticos actuales

Comentarios:

Enviar
PremiumAbout & FeedbackAcuerdoPrivacidad
logo
© 2022 Selected Technologies LLC – Morgan Hill, California