33
/es/
AIzaSyB4mHJ5NPEv-XzF7P6NDYXjlkCWaeKw5bc
November 30, 2025
25725
Central Europe and the Baltics
CEB
false
2
1
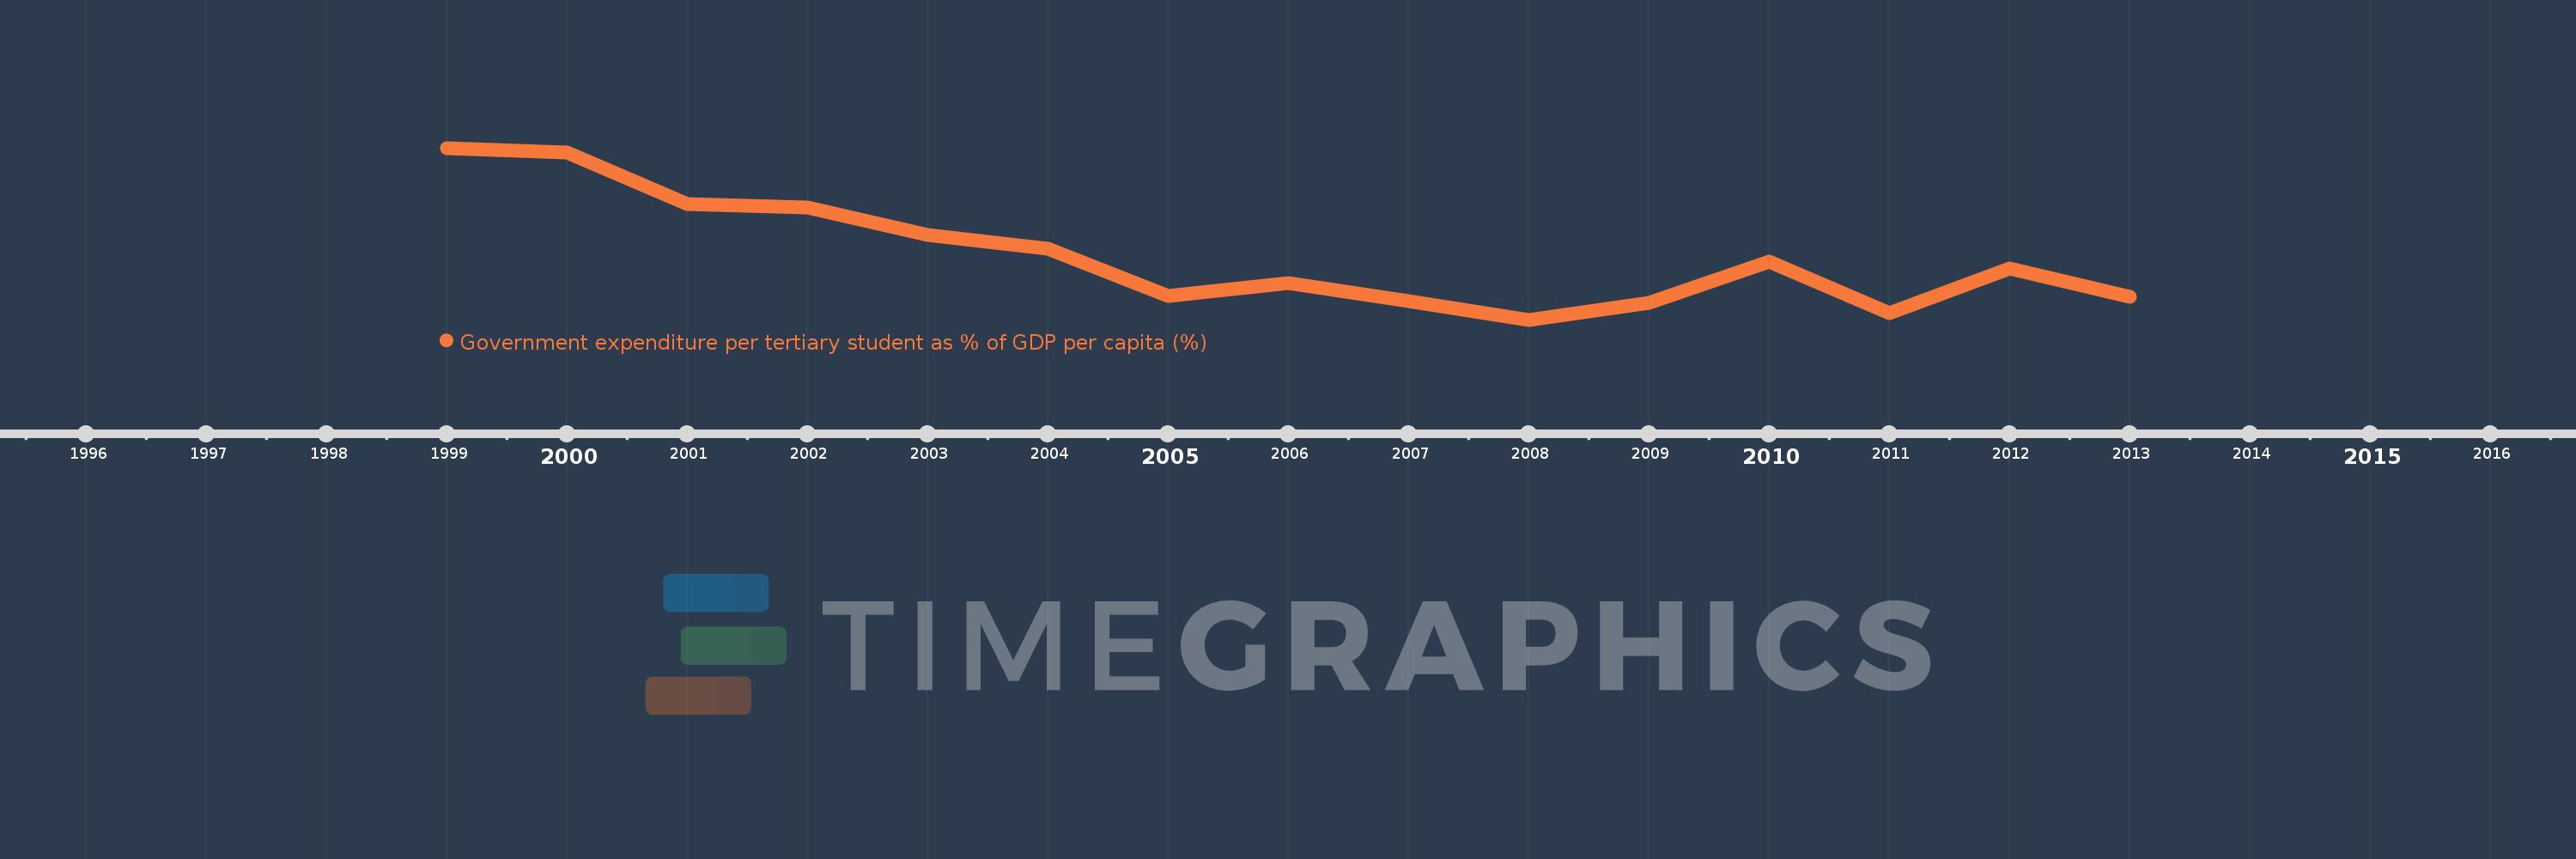
Government expenditure per tertiary student as % of GDP per capita (%)
2013,2012,2011,2010,2009,2008,2007,2006,2005,2004,2003,2002,2001,2000,1999