33
/es/
AIzaSyAYiBZKx7MnpbEhh9jyipgxe19OcubqV5w
August 1, 2025
25612
Central Europe and the Baltics
CEB
false
2
1
Employers, male (% of male employment)
2015,2014,2013,2012,2011,2010,2009,2008,2007,2006,2005,2004,2003,2002,2001,2000,1999,1998
Download
Estadísticas Globales de la Biblioteca →Central Europe and the Baltics →

Employers, male (% of male employment)

Estas estadísticas en otros países:

AlbaniaAlgeriaAmerican SamoaAntigua and BarbudaArgentinaArmeniaArubaAustriaAzerbaijanBahrainBangladeshBarbadosBelarusBelgiumBelizeBeninBermudaBhutanBoliviaBotswanaBrazilBritish Virgin IslandsBrunei DarussalamBulgariaBurkina FasoBurundiCabo VerdeCambodiaCameroonCaribbean small statesCayman IslandsCentral Europe and the BalticsChadChileColombiaCongo, Rep.Costa RicaCote d'IvoireCroatiaCyprusCzech RepublicDenmarkDjiboutiDominicaDominican RepublicEarly-demographic dividendEcuadorEgypt, Arab Rep.El SalvadorEstoniaEthiopiaEuro areaEurope & Central AsiaEurope & Central Asia (excluding high income)Europe & Central Asia (IDA & IBRD countries)European UnionFijiFinlandFranceGabonGambia, TheGeorgiaGermanyGhanaGreeceGrenadaGuatemalaGuineaHondurasHong Kong SAR, ChinaHungaryIcelandIndiaIndonesiaIran, Islamic Rep.IrelandIsle of ManItalyJamaicaJordanKazakhstanKiribatiKosovoKuwaitKyrgyz RepublicLao PDRLatin America & Caribbean Latin America & Caribbean (excluding high income)Latin America & the Caribbean (IDA & IBRD countries)LatviaLebanonLesothoLiberiaLithuaniaLower middle incomeLuxembourgMacao SAR, ChinaMacedonia, FYRMadagascarMalawiMalaysiaMaldivesMaliMaltaMarshall IslandsMauritiusMiddle East & North Africa (excluding high income)Middle East & North Africa (IDA & IBRD countries)MoldovaMongoliaMoroccoMozambiqueNamibiaNepalNetherlandsNicaraguaNigerNorwayOmanPakistanPanamaParaguayPeruPhilippinesPolandPortugalQatarRomaniaRussian FederationRwandaSamoaSan MarinoSao Tome and PrincipeSaudi ArabiaSenegalSerbiaSeychellesSingaporeSlovak RepublicSloveniaSouth AfricaSouth AsiaSouth Asia (IDA & IBRD)SpainSri LankaSt. Kitts and NevisSt. LuciaSt. Vincent and the GrenadinesSurinameSwazilandSwedenSwitzerlandSyrian Arab RepublicTajikistanTanzaniaThailandTimor-LesteTongaTrinidad and TobagoTunisiaTurkeyTurks and Caicos IslandsTuvaluUgandaUkraineUnited Arab EmiratesUnited KingdomUruguayVanuatuVenezuela, RBVietnamWest Bank and GazaYemen, Rep.ZambiaZimbabwe

línea de tiempo (timeline):

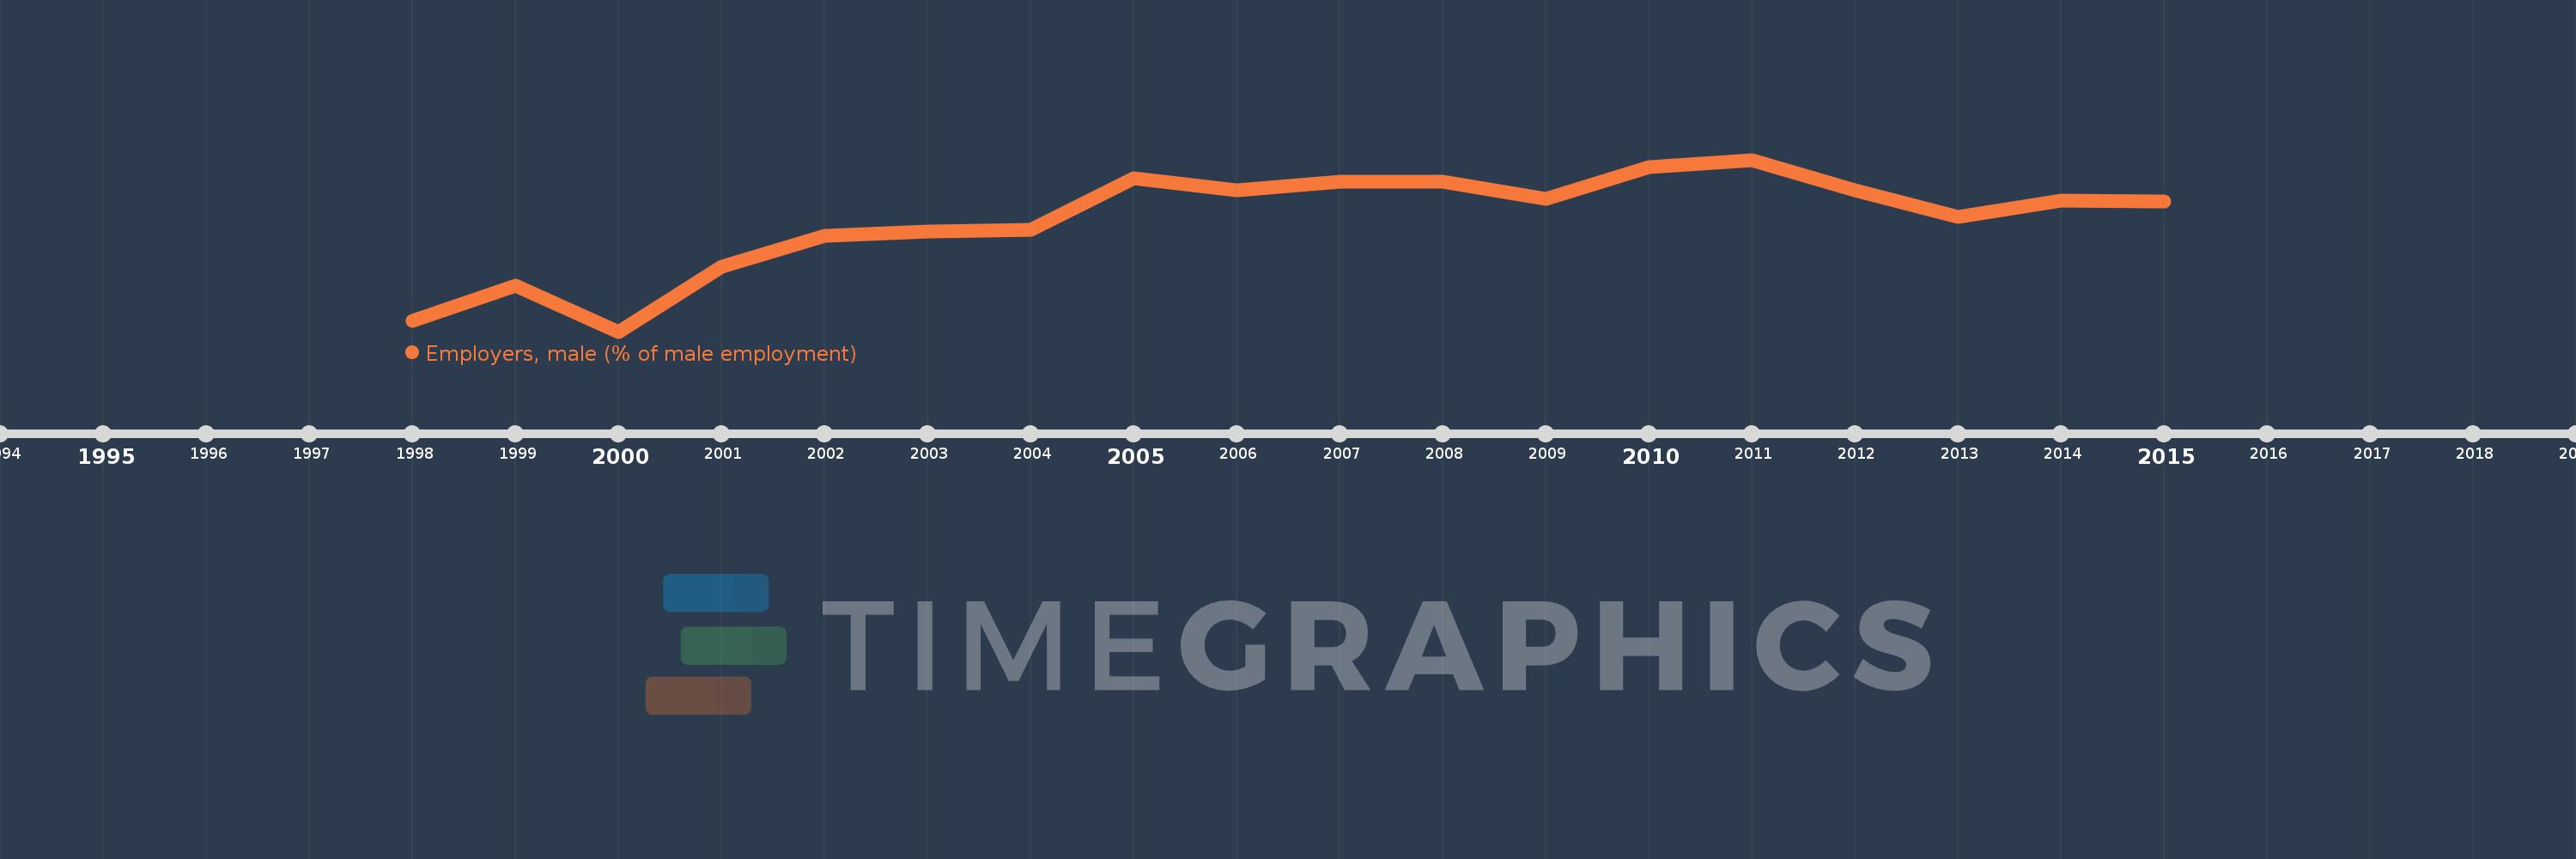
En esta escala de tiempo se presenta un gráfico de 1998 y 2015 de Central Europe and the Baltics. Los datos de 1997 están ausentes. El número de observaciones reales por fecha: 18.

Fuente (nombre):

Indicadores del desarrollo mundial

Fuente (organización):

ILO Key Indicators of the Labour Market (KILM).

Categorías:

Social Protection & Labor, Gender

Se ha actualizado:

23 abr 2017 año

Los indicadores de los cambios de valor en los últimos años

En promedio:
4.438
Mínimo:
3.861
1 ene 2000 año
Máximo:
4.754
1 ene 2011 año
A la fecha de observación
Valor
Cambio absoluto
El cambio con respecto al valor anterior
1 ene 1998 año
3.916
+3.916
0.0%
1 ene 1999 año
4.098
+0.182
4.64%
1 ene 2000 año
3.861
-0.237
-5.78%
1 ene 2001 año
4.196
+0.335
8.68%
1 ene 2002 año
4.36
+0.163
3.89%
1 ene 2003 año
4.379
+0.019
0.45%
1 ene 2004 año
4.388
+0.009
0.21%
1 ene 2005 año
4.659
+0.271
6.17%
1 ene 2006 año
4.594
-0.065
-1.39%
1 ene 2007 año
4.642
+0.047
1.03%
1 ene 2008 año
4.64
-0.002
-0.04%
1 ene 2009 año
4.552
-0.088
-1.89%
1 ene 2010 año
4.718
+0.166
3.64%
1 ene 2011 año
4.754
+0.037
0.78%
1 ene 2012 año
4.597
-0.157
-3.3%
1 ene 2013 año
4.459
-0.138
-3.0%
1 ene 2014 año
4.54
+0.08
1.8%
1 ene 2015 año
4.539
-0.001
-0.03%

Ranking de los países por los datos estadísticos actuales